SOURCED REPORTING · 2026-10-14
Prices outran pay in September. Gasoline led the jump.
Today’s BLS releases show consumer prices rose 0.6% in September while average hourly pay rose 0.1%. After inflation, average hourly earnings for private nonfarm payroll employees fell 0.5%. Gasoline supplied more than half the monthly price rise; groceries edged down. [1] [2] [3] [6]
United States CPI-U, September 2026, October 14 release vintage. Monthly figures below are seasonally adjusted; twelve-month figures are unadjusted. National category indexes do not measure any particular household’s bill. Real earnings refer to all employees on private nonfarm payrolls, not every worker or the same people tracked through time.
August to September 2026 · seasonally adjusted · percent change
National category indexes with different weights. These bars show rates of change, not contributions to the overall CPI or dollar changes in a household bill.
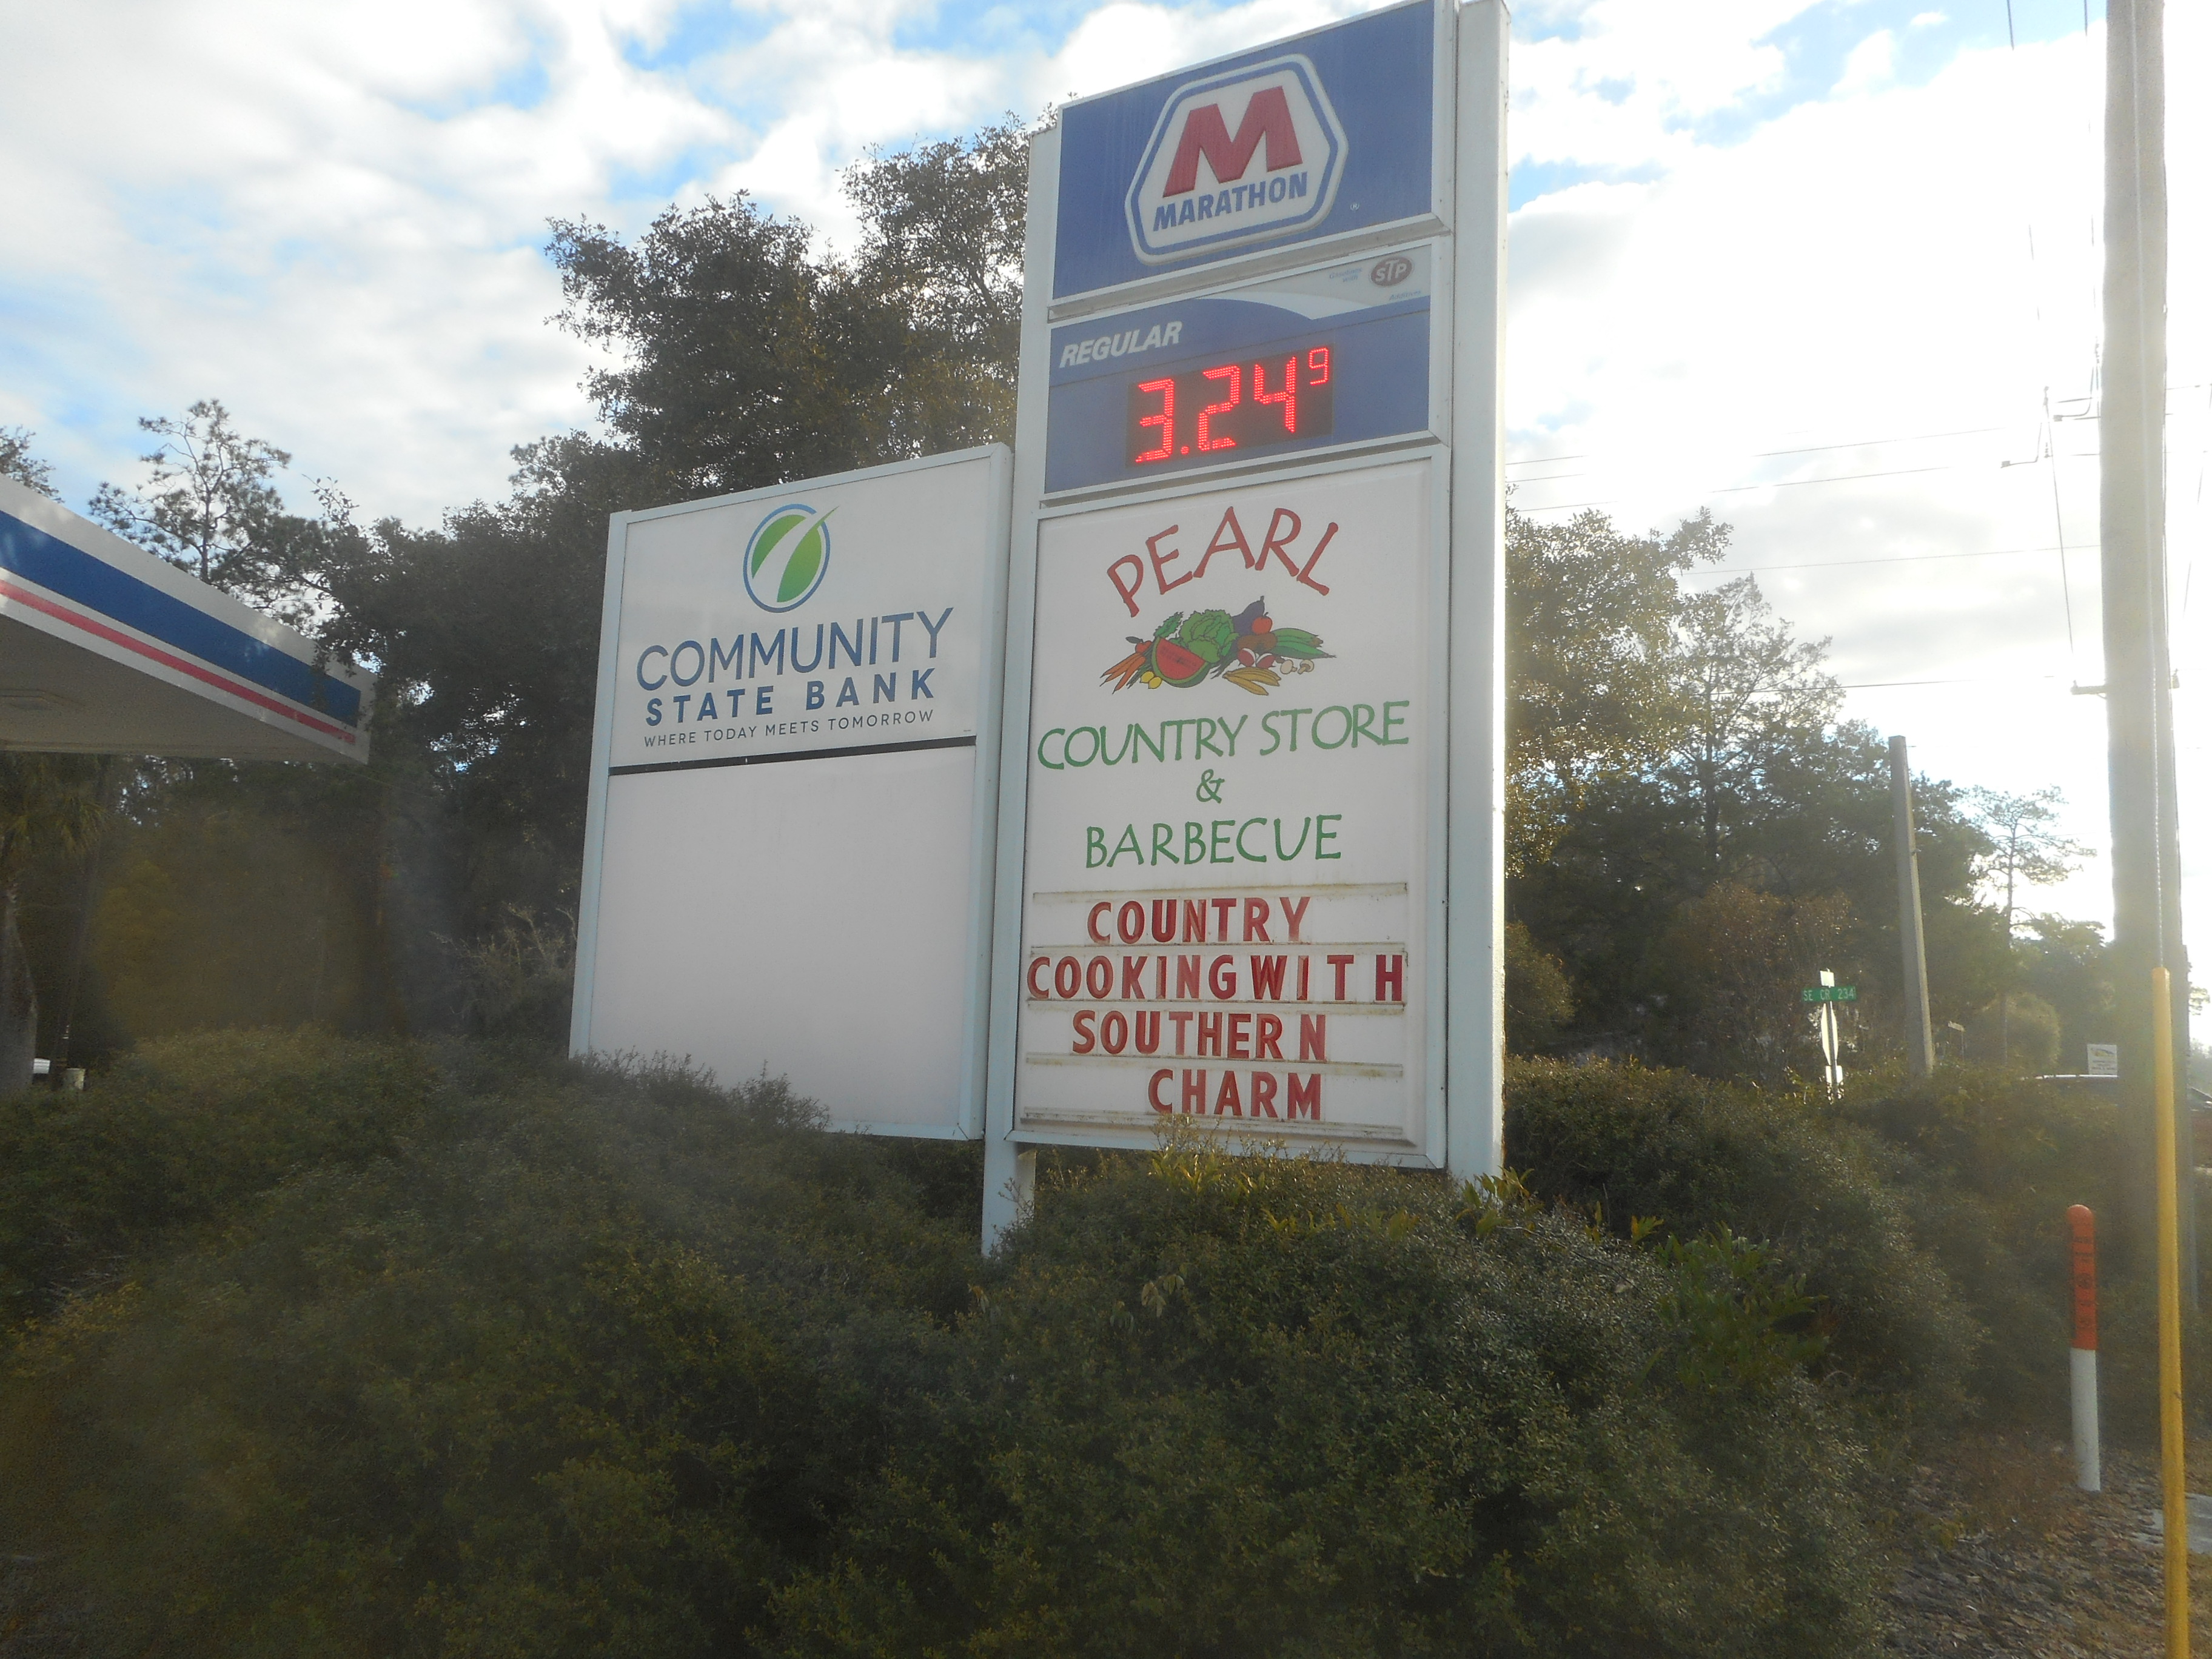
Archive photograph · 2022-12-29 · Micanopy, Florida
- 2 source records
- U.S. Bureau of Labor Statistics
How we know6 scoped claims · 2 source recordsView evidence
Each claim keeps its full assertion, date, source passage and limits. Source counts describe records, not independent corroboration.
1.Inflation increasedSupported
BLS reports CPI-U rose 0.6% in September, seasonally adjusted, after 0.4% in August. The unadjusted twelve-month increase was 3.7%, compared with August’s 3.4%.
- Scope
- United States CPI-U, September 2026, October 14 release vintage. Monthly figures below are seasonally adjusted; twelve-month figures are unadjusted. National category indexes do not measure any particular household’s bill.
- Evidence passage
- October 14 CPI summary, opening paragraph and twelve-month paragraph; table A, All items.
- As of
- 2026-10-14
- Limit
- Monthly and twelve-month changes have different periods and seasonal treatments.
Retrieved 2026-10-14T15:56:31.164Z · U.S. Bureau of Labor Statistics
United States CPI-U, September 2026, October 14 release vintage. Monthly figures below are seasonally adjusted; twelve-month figures are unadjusted. National category indexes do not measure any particular household’s bill.
2.Gasoline drove over half the monthly riseSupported
BLS reports gasoline prices rose 9.1% in September and accounted for more than half of the monthly all-items increase.
- Scope
- United States CPI-U, September 2026, October 14 release vintage. Monthly figures below are seasonally adjusted; twelve-month figures are unadjusted. National category indexes do not measure any particular household’s bill.
- Evidence passage
- October 14 CPI summary, second paragraph; table A, Gasoline (all types).
- As of
- 2026-10-14
- Limit
- A national category index, not the price posted at a particular station.
Retrieved 2026-10-14T15:56:31.164Z · U.S. Bureau of Labor Statistics
United States CPI-U, September 2026, October 14 release vintage. Monthly figures below are seasonally adjusted; twelve-month figures are unadjusted. National category indexes do not measure any particular household’s bill.
3.Groceries edged downSupported
BLS reports the food-at-home index fell 0.1% in September, while the overall food index was unchanged.
- Scope
- United States CPI-U, September 2026, October 14 release vintage. Monthly figures below are seasonally adjusted; twelve-month figures are unadjusted. National category indexes do not measure any particular household’s bill.
- Evidence passage
- October 14 CPI summary, second paragraph; Food section; table A, Food at home.
- As of
- 2026-10-14
- Limit
- An average across the category; individual products and households can differ.
Retrieved 2026-10-14T15:56:31.164Z · U.S. Bureau of Labor Statistics
United States CPI-U, September 2026, October 14 release vintage. Monthly figures below are seasonally adjusted; twelve-month figures are unadjusted. National category indexes do not measure any particular household’s bill.
4.Shelter roseSupported
BLS reports the shelter index rose 0.4% in September after rising 0.3% in August.
- Scope
- United States CPI-U, September 2026, October 14 release vintage. Monthly figures below are seasonally adjusted; twelve-month figures are unadjusted. National category indexes do not measure any particular household’s bill.
- Evidence passage
- October 14 CPI summary, second paragraph; table A, Shelter.
- As of
- 2026-10-14
- Limit
- An aggregate index, not the rent change faced by every tenant.
Retrieved 2026-10-14T15:56:31.164Z · U.S. Bureau of Labor Statistics
United States CPI-U, September 2026, October 14 release vintage. Monthly figures below are seasonally adjusted; twelve-month figures are unadjusted. National category indexes do not measure any particular household’s bill.
5.The increase extended beyond energySupported
BLS reports the index excluding food and energy rose 0.3% in September and 2.6% over twelve months.
- Scope
- United States CPI-U, September 2026, October 14 release vintage. Monthly figures below are seasonally adjusted; twelve-month figures are unadjusted. National category indexes do not measure any particular household’s bill.
- Evidence passage
- October 14 CPI summary, third and fourth paragraphs; table A, All items less food and energy.
- As of
- 2026-10-14
- Limit
- Excluding volatile categories does not remove them from household spending.
Retrieved 2026-10-14T15:56:31.164Z · U.S. Bureau of Labor Statistics
United States CPI-U, September 2026, October 14 release vintage. Monthly figures below are seasonally adjusted; twelve-month figures are unadjusted. National category indexes do not measure any particular household’s bill.
6.Average pay bought lessSupported
BLS reports that real average hourly earnings for all employees fell 0.5% from August to September, seasonally adjusted. Nominal average hourly earnings rose 0.1%, while CPI-U rose 0.6%. Real average weekly earnings also fell 0.5%, with the average workweek unchanged.
- Scope
- All employees on U.S. private nonfarm payrolls, August to September 2026, seasonally adjusted.
- Evidence passage
- Real Earnings Summary, USDL-26-1575, All employees, first two paragraphs; Table A-1 title identifies private nonfarm payroll coverage.
- As of
- 2026-10-14
- Limit
- Average earnings do not track the same worker over time or measure every household budget. This story uses only the all-employees section.
Retrieved 2026-10-14T15:57:25.582Z · U.S. Bureau of Labor Statistics
Average earnings do not track the same worker over time or measure every household budget. This story uses only the all-employees section.
Still open: United States CPI-U, September 2026, October 14 release vintage. Monthly figures below are seasonally adjusted; twelve-month figures are unadjusted. National category indexes do not measure any particular household’s bill.
What remains unresolved
- United States CPI-U, September 2026, October 14 release vintage. Monthly figures below are seasonally adjusted; twelve-month figures are unadjusted. National category indexes do not measure any particular household’s bill.
- No individual pay records, household budgets or interviews were collected. Real earnings are an aggregate estimate; composition changes can affect the average.
A new official record, correction or material change would trigger a new captured revision and reconciliation of the affected claims.