SOURCED REPORTING · 2026-10-15
Producer prices jumped 1.3% in September as energy surged
U.S. final-demand producer prices rose 1.3% in September, BLS reported today. Goods rose 2.6% and services 0.8%; energy accounted for more than 80% of the goods increase. The report measures producers’ selling prices, so it does not mean household bills rose by the same amount. [1] [2] [3] [4]
BLS September 2026 PPI, released October 15. Monthly changes are seasonally adjusted; annual changes are unadjusted. Prices received by domestic producers are a different measure from household prices paid, and this record does not forecast a particular bill.
September 2026 versus August 2026, seasonally adjusted · percent change
U.S. producer-price indexes. Each bar is its own index change; these are not percentage-point contributions or household-price increases.
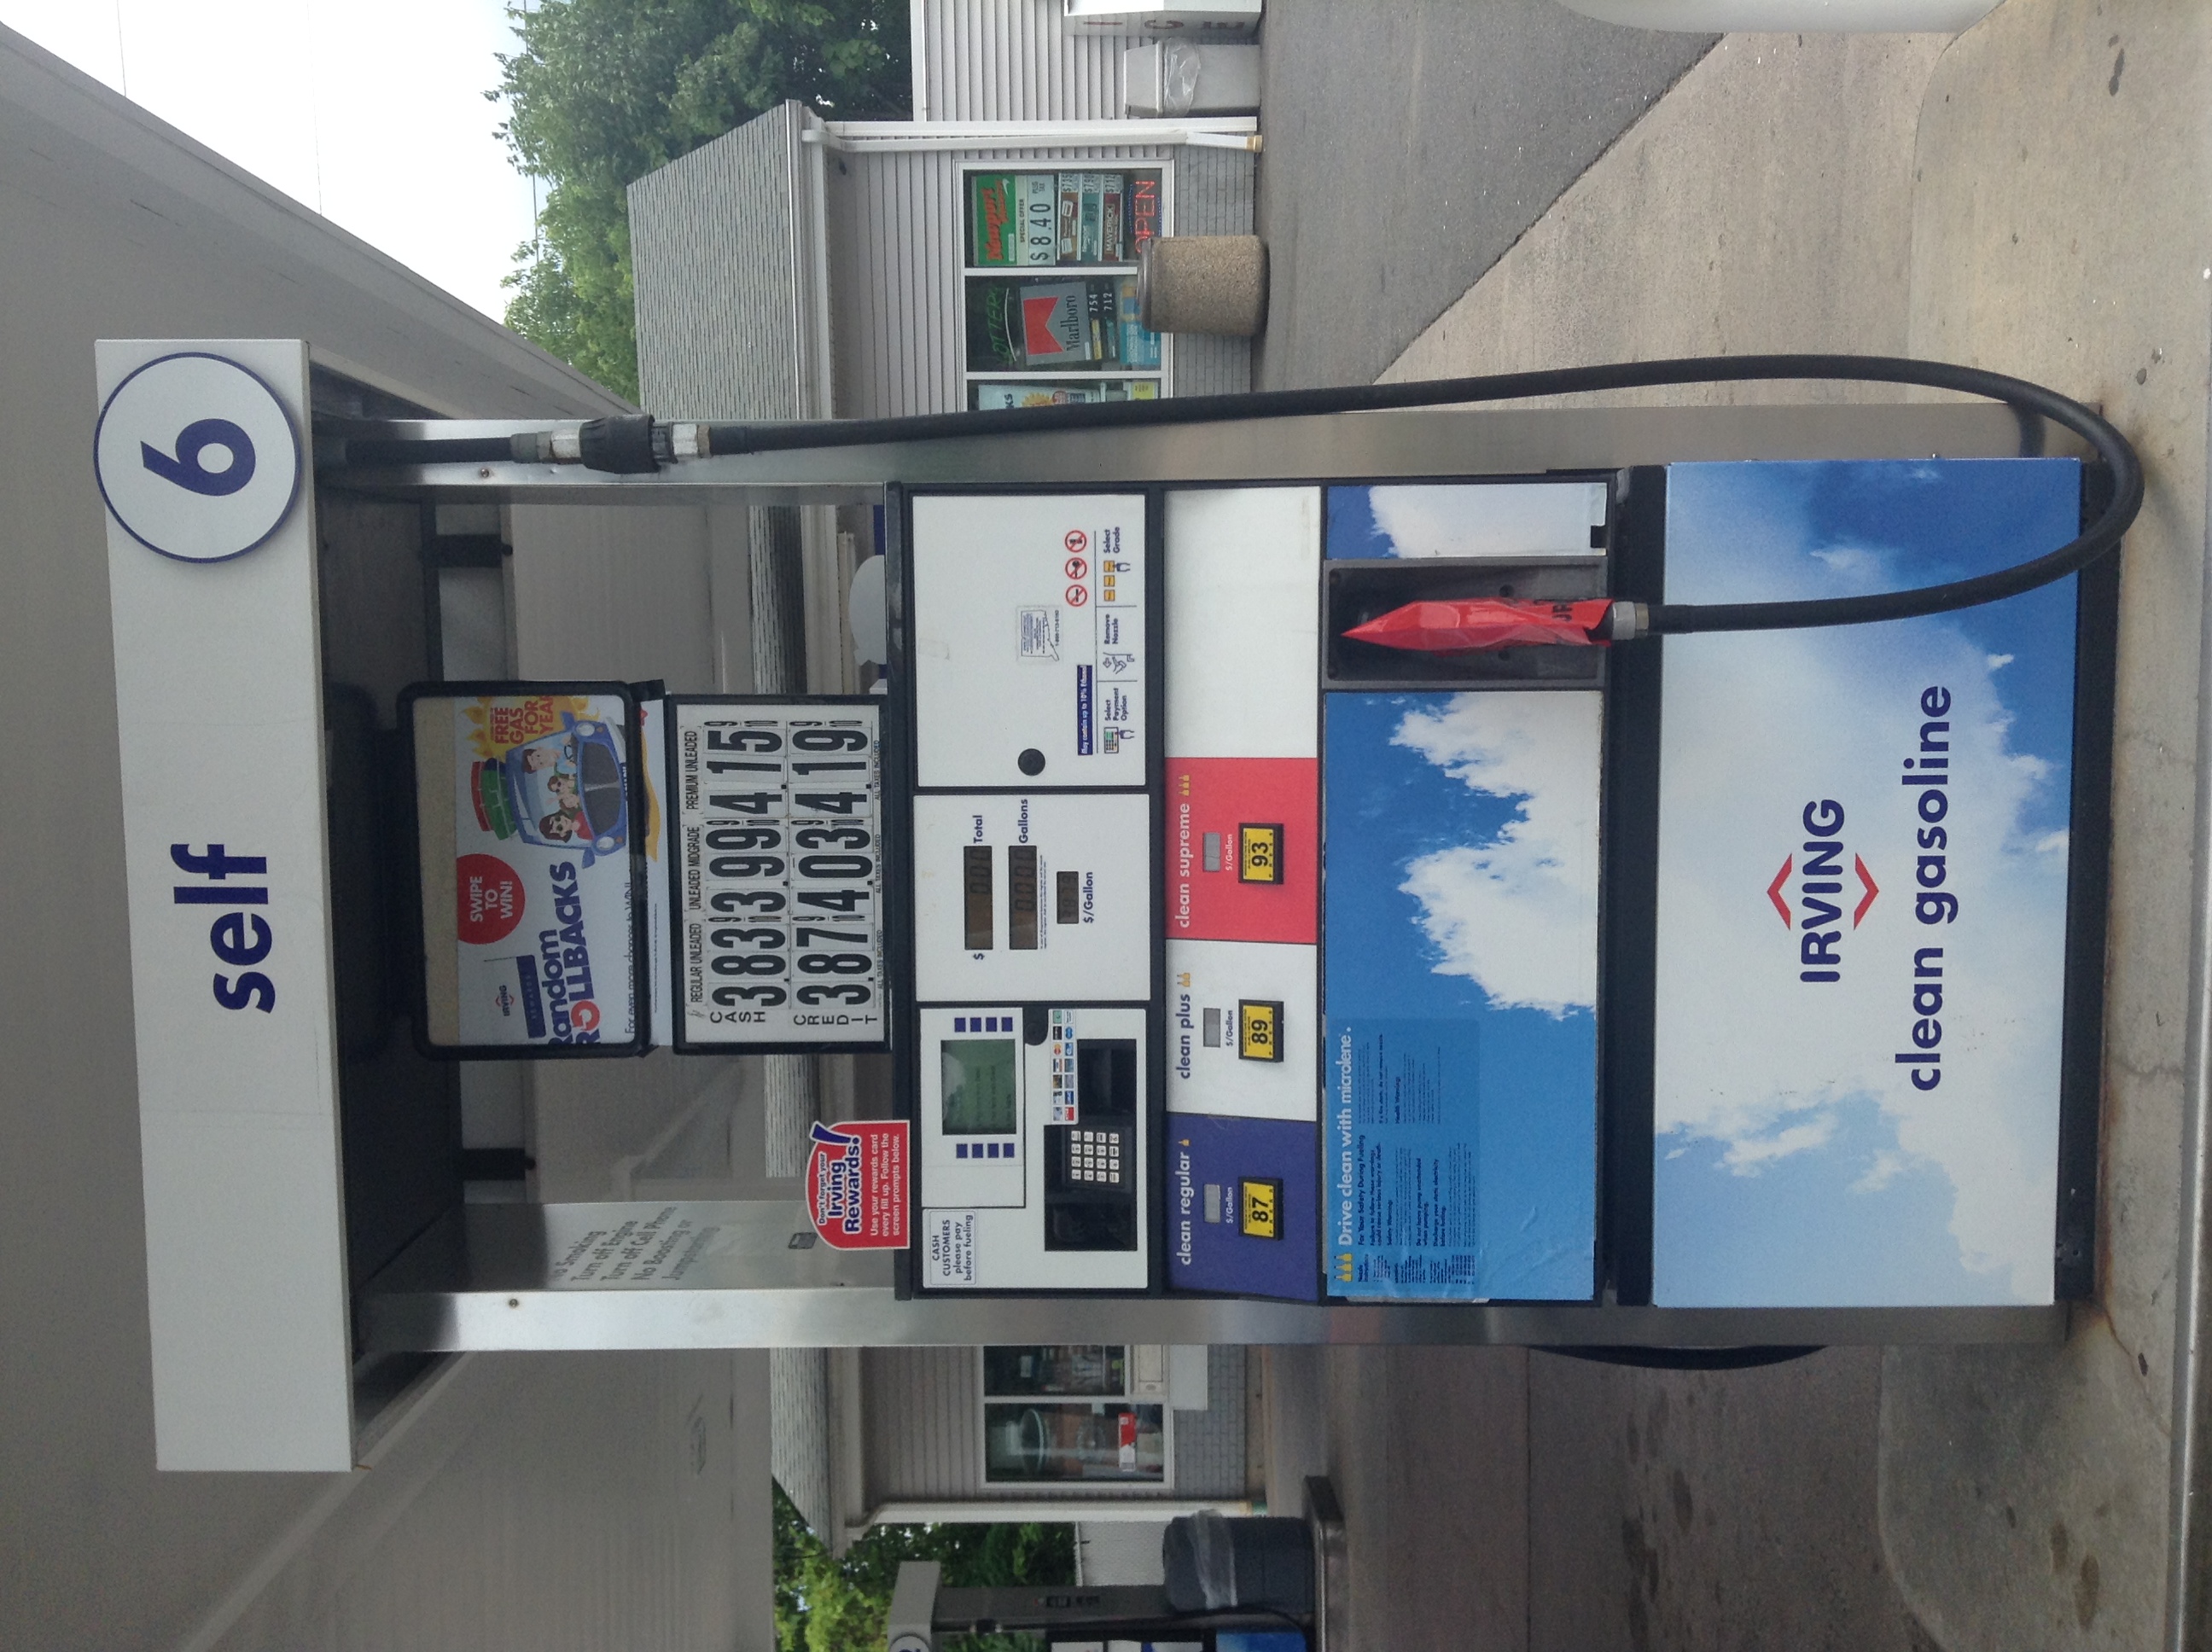
Archive photograph · 2014-06-24 · Exact station location not specified in the retained Commons description.
- 2 source records
- US Bureau of Labor Statistics
How we know4 scoped claims · 2 source recordsView evidence
Each claim keeps its full assertion, date, source passage and limits. Source counts describe records, not independent corroboration.
1.The new monthly and annual readingsSupported
Final-demand PPI increased 1.3% in September, seasonally adjusted, following 0.5% in August. Its 12-month increase was 6.3%, unadjusted.
- Scope
- BLS September 2026 PPI, released October 15. Monthly changes are seasonally adjusted; annual changes are unadjusted. Prices received by domestic producers are a different measure from household prices paid, and this record does not forecast a particular bill.
- Evidence passage
- USDL 26-1576 opening paragraphs and Table A, September and August 2026 rows.
- As of
- 2026-10-15
- Limit
- Monthly and annual changes use different seasonal bases and periods; they are not additive or interchangeable.
Retrieved 2026-10-15T20:01:19.053Z · US Bureau of Labor Statistics
USDL 26-1576 September release, actual release header, summary, Table A and revision footnote.
2.Goods and services both roseSupported
September final-demand goods prices increased 2.6% and final-demand services increased 0.8%, both seasonally adjusted.
- Scope
- BLS September 2026 PPI, released October 15. Monthly changes are seasonally adjusted; annual changes are unadjusted. Prices received by domestic producers are a different measure from household prices paid, and this record does not forecast a particular bill.
- Evidence passage
- Summary and Final Demand → goods and services paragraphs.
- As of
- 2026-10-15
- Limit
- Changes in separate aggregate price indexes, not percentage-point contributions to the overall increase.
Retrieved 2026-10-15T20:01:19.053Z · US Bureau of Labor Statistics
USDL 26-1576 September release, actual release header, summary, Table A and revision footnote.
3.Energy drove much of the goods riseSupported
BLS attributes more than 80% of September’s final-demand goods increase to energy, whose index rose 10.8%; gasoline prices in the producer index rose 20.3%.
- Scope
- BLS September 2026 PPI, released October 15. Monthly changes are seasonally adjusted; annual changes are unadjusted. Prices received by domestic producers are a different measure from household prices paid, and this record does not forecast a particular bill.
- Evidence passage
- Final Demand → Final demand goods and Product detail.
- As of
- 2026-10-15
- Limit
- The more-than-80% denominator is the goods increase, not all final demand; producer gasoline prices are not pump prices.
Retrieved 2026-10-15T20:01:19.053Z · US Bureau of Labor Statistics
USDL 26-1576 September release, actual release header, summary, Table A and revision footnote.
4.Measure and revision boundarySupported
PPI measures average changes in selling prices received by domestic producers. BLS notes that May through August figures in this release were revised for late reports and respondent corrections.
- Scope
- BLS September 2026 PPI, released October 15. Monthly changes are seasonally adjusted; annual changes are unadjusted. Prices received by domestic producers are a different measure from household prices paid, and this record does not forecast a particular bill.
- Evidence passage
- PPI Technical Note opening definition; September release Table A revision footnote.
- As of
- 2026-10-15
- Limit
- Different producer and consumer coverage prevents translating this percentage into an identical household price increase. These are October 15 vintage figures.
Retrieved 2026-10-15T20:01:19.053Z · US Bureau of Labor Statistics
USDL 26-1576 September release, actual release header, summary, Table A and revision footnote.
Retrieved 2026-10-15T20:01:19.114Z · US Bureau of Labor Statistics
PPI technical note: definition and revisions, undated background.
Still open: No estimate of household pass-through or a particular business’s costs is established.
What remains unresolved
- No estimate of household pass-through or a particular business’s costs is established.
- The new Census retail report is visible on the official website, but its host is outside the installed capture family; it is not used as evidence or silently combined with PPI.
- The BLS original was captured and reviewed, but ordinary browser access returned HTTP 403 during reader QA. Original evidence receipts remain available; practical help uses an accessible official USAGov resource.
A BLS correction, incompatible seasonal basis or revised component contribution. A new original record requires a separately identified revision and renewed source review.