← 2026-10-21 edition · Sourced reporting
Published Oct 21, 2026, 3:43 PM Central · This version Oct 21, 2026, 3:43 PM Central · As of 2026-10-21
Median weekly pay rose 1.5%; prices rose 3.5%
The new BLS estimate shows full-time median gross weekly pay rising more slowly than consumer prices over the year to Q3 2026: 1.5% versus 3.5%. Median pay was $1,232 a week. This is a national survey benchmark, not a finding about your raise or take-home pay. [1] [2] [3]
Checking a pay offer? Use the Labor Department’s wages page to find minimum-wage and overtime guidance and worker resources. The national earnings median is a statistical benchmark, not a determination of your pay entitlement. →United States, third-quarter 2026 usual weekly earnings of full-time wage and salary workers; October 21 BLS release. Year-over-year comparisons are not seasonally adjusted. Gross main-job earnings, not take-home pay, a panel of identical workers, individual raises or a household inflation measure.
- 1 source record
- U.S. Bureau of Labor Statistics
Still open: No individual worker panel, take-home-pay calculation or local household price basket. All open questions ↓
Reporting question · As of 2026-10-21
The question: Did the new U.S. full-time earnings estimate keep pace with consumer prices?
United States, third-quarter 2026 usual weekly earnings of full-time wage and salary workers; October 21 BLS release. Year-over-year comparisons are not seasonally adjusted. Gross main-job earnings, not take-home pay, a panel of identical workers, individual raises or a household inflation measure.
Q3 2025 to Q3 2026 · percent change from a year earlier
U.S. full-time wage and salary median earnings versus CPI-U, each relative to its own year-earlier value. Published rounded rates, not seasonally adjusted; different underlying populations. No dollar-level comparison, individual result or exact real-pay calculation.
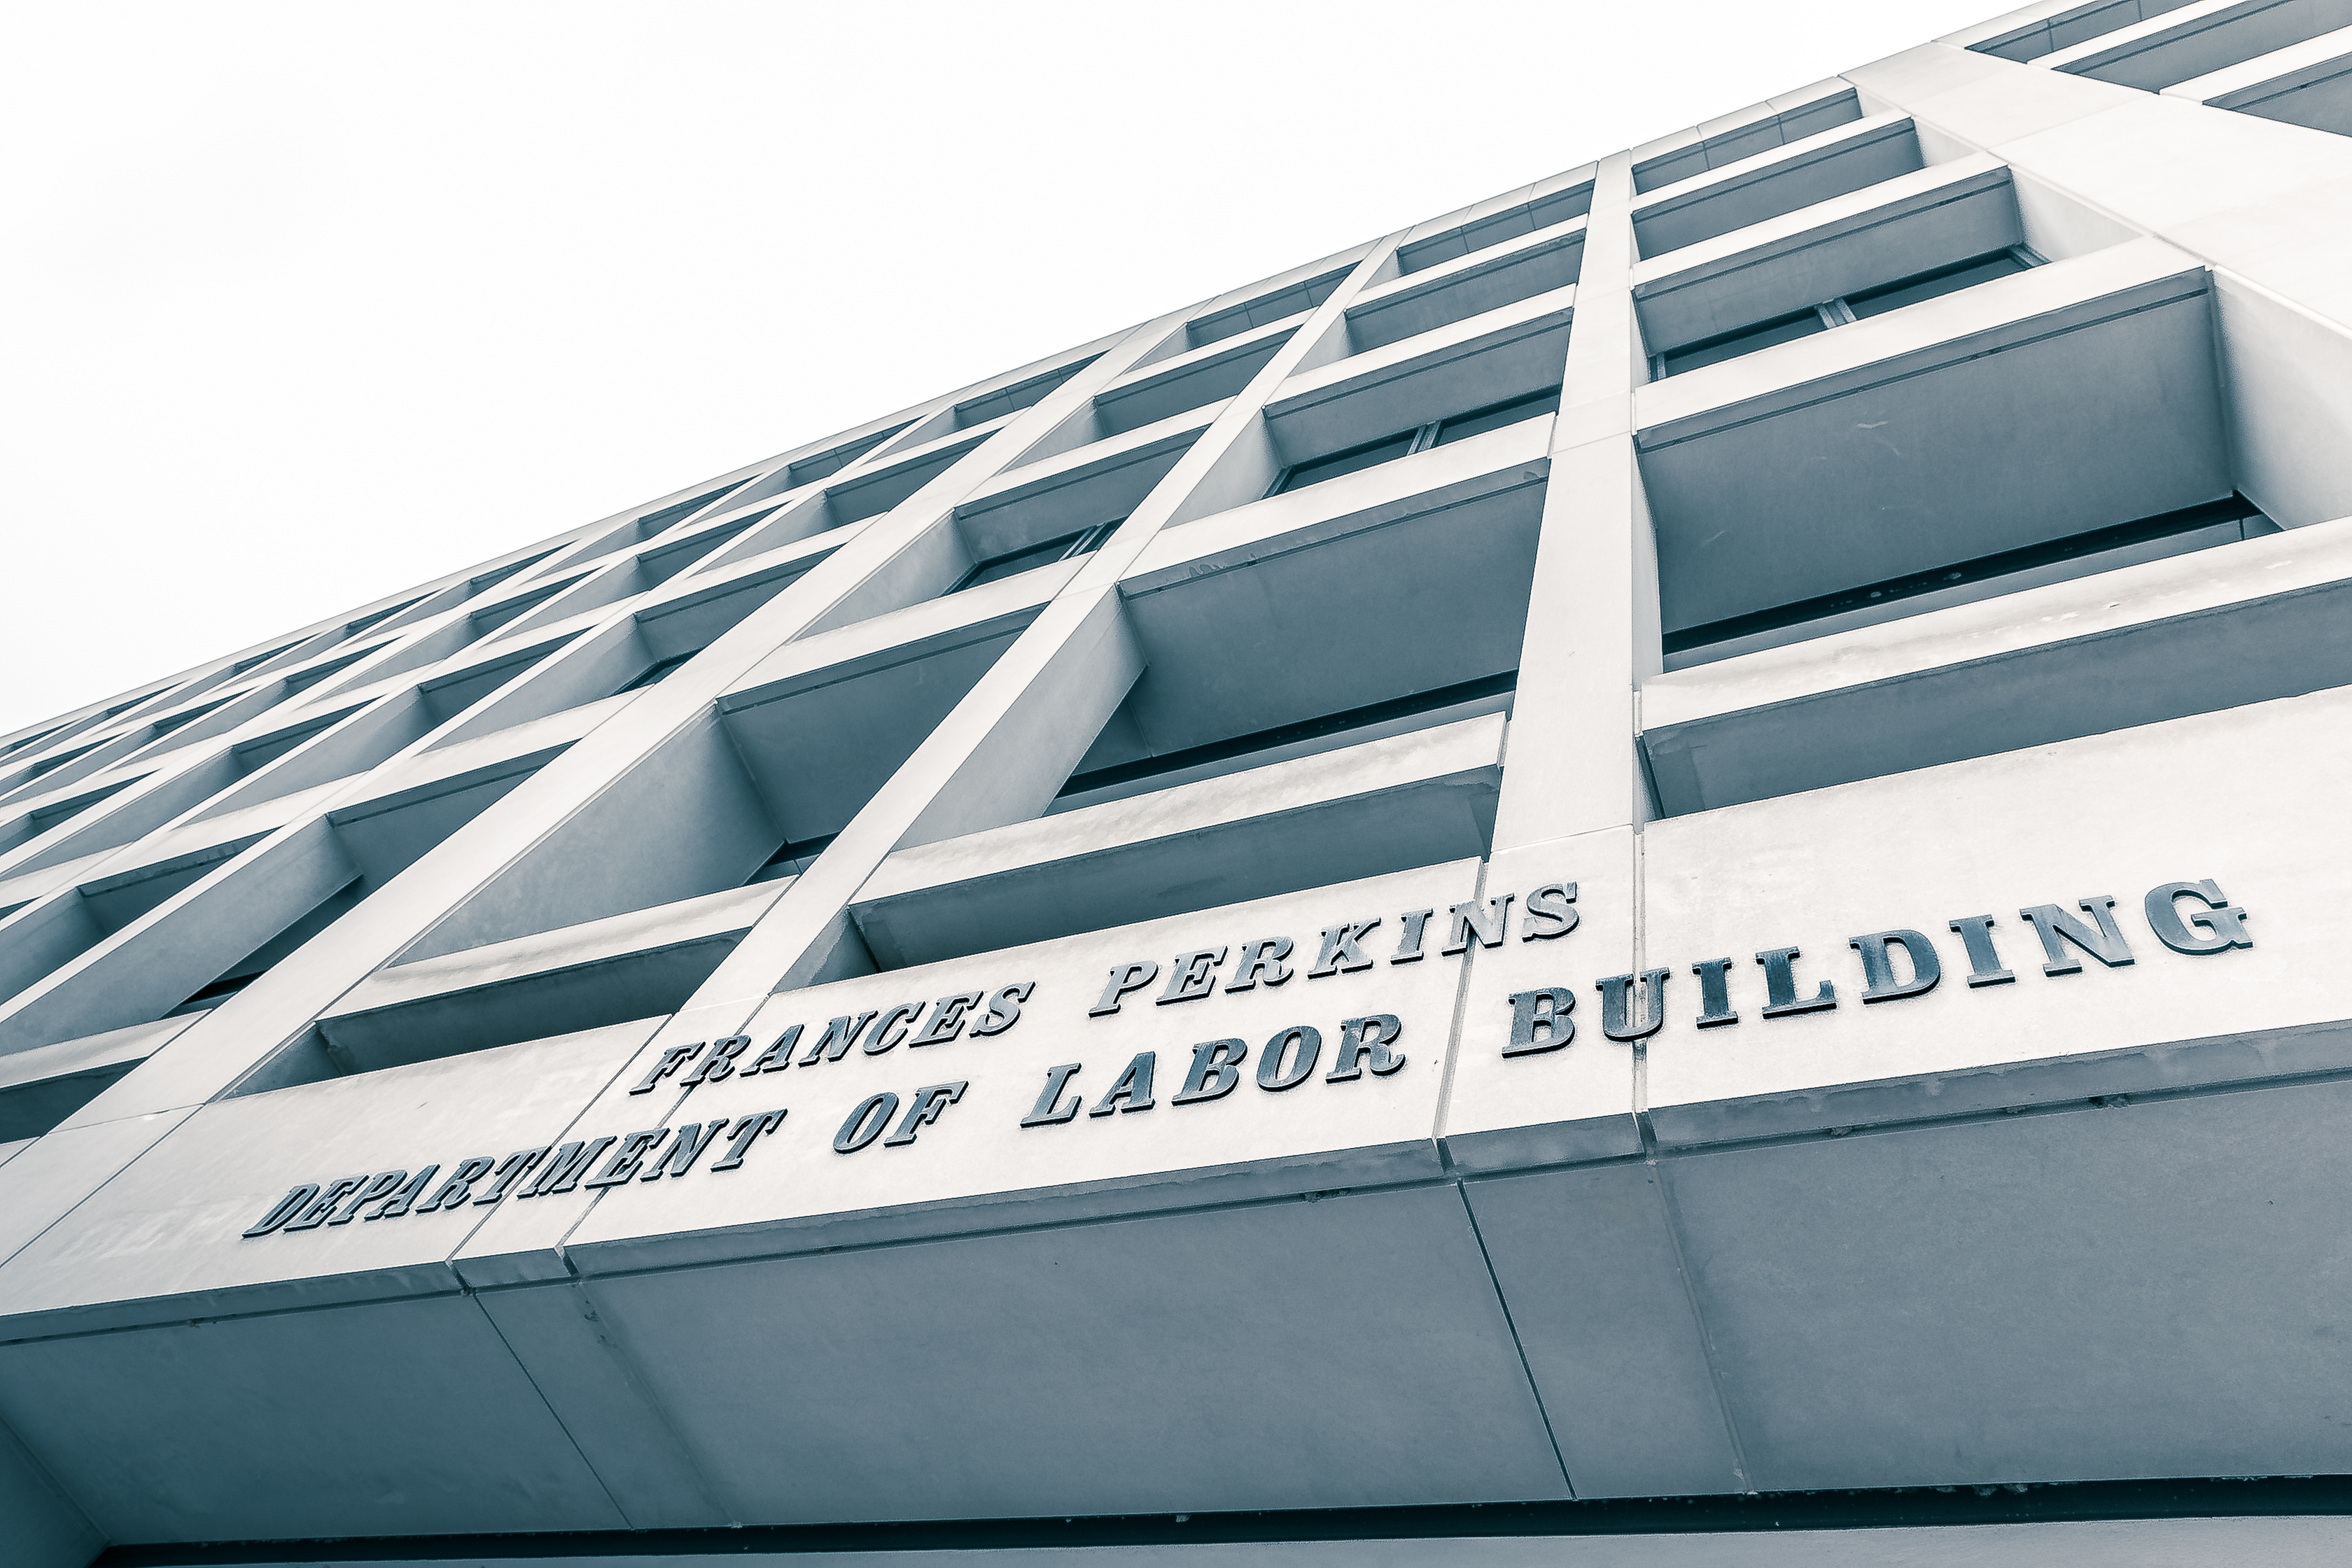
Archive photograph · 2017-06-14 · Washington, D.C., United States

Understand the story.
The new pay estimate trails prices
BLS’s October 21 release puts median usual weekly earnings at $1,232 for 122.2 million full-time wage and salary workers in the third quarter. The published year-over-year earnings increase is 1.5%; CPI-U rose 3.5% over the same period. These estimates show median gross pay growing more slowly than the broad consumer-price index. They do not describe every worker’s experience. [1] [2]
Keep the comparison on one clock
The chart compares the release’s two year-over-year percentage changes for the same quarter. Both start from their own year-earlier measure. It does not compare dollar levels, subtract inflation to produce an exact real-pay rate, or mix an unadjusted annual comparison with a seasonally adjusted quarterly one. [2]
Who this median leaves out
Full-time means usually working at least 35 hours a week at the sole or main job. The earnings figure is before taxes and deductions and includes usual overtime, commissions and tips. Self-employed workers are excluded; part-time workers are outside this full-time median. A changing mix of workers can move the median even without a matching change in any one person’s pay. [3] [4]
Use it to frame a pay question
When comparing a pay offer or raise, put gross earnings on a weekly basis over the same period, then consider your hours, deductions and actual expenses separately. The Labor Department’s wages page links minimum-wage and overtime guidance and worker resources; this national median cannot determine a legal pay entitlement. CPS figures are sample estimates with sampling and nonsampling error. This report has not calculated a significance test or a personal purchasing-power result. [3] [5] [2]
How we know5 scoped claims · 1 source recordView evidence
Each claim keeps its full assertion, date, source passage and limits. Source counts describe records, not independent corroboration.
1.Claim 1Supported
BLS estimates median usual weekly earnings of 122.2 million U.S. full-time wage and salary workers at $1,232 in Q3 2026, not seasonally adjusted.
- Scope
- United States, third-quarter 2026 usual weekly earnings of full-time wage and salary workers; October 21 BLS release. Year-over-year comparisons are not seasonally adjusted. Gross main-job earnings, not take-home pay, a panel of identical workers, individual raises or a household inflation measure.
- Evidence passage
- Summary opening paragraph; Table 2, Total full-time wage and salary workers, Q3 2026.
- As of
- 2026-10-21
- Limit
- A population median is not an average, an individual raise, or take-home pay.
Retrieved 2026-10-21T20:02:07.265Z · U.S. Bureau of Labor Statistics
CPS sample estimates have sampling and nonsampling error; changing worker composition can change a median. Published rounded growth rates are not personal outcomes or a causal policy test.
2.Claim 2Supported
The BLS release reports a 1.5% year-over-year increase in median weekly earnings and a 3.5% increase in CPI-U over the same period.
- Scope
- United States, third-quarter 2026 usual weekly earnings of full-time wage and salary workers; October 21 BLS release. Year-over-year comparisons are not seasonally adjusted. Gross main-job earnings, not take-home pay, a panel of identical workers, individual raises or a household inflation measure.
- Evidence passage
- Summary opening paragraph, Q3 2026 compared with a year earlier.
- As of
- 2026-10-21
- Limit
- Rounded published year-over-year rates; this does not estimate every worker’s real pay or household prices. No claim of statistical significance is made.
Retrieved 2026-10-21T20:02:07.265Z · U.S. Bureau of Labor Statistics
CPS sample estimates have sampling and nonsampling error; changing worker composition can change a median. Published rounded growth rates are not personal outcomes or a causal policy test.
3.Claim 3Supported
CPS usual weekly earnings are before taxes and deductions, include usual overtime, commissions and tips at the main job, and exclude all self-employed workers; full-time means usually at least 35 hours a week.
- Scope
- United States, third-quarter 2026 usual weekly earnings of full-time wage and salary workers; October 21 BLS release. Year-over-year comparisons are not seasonally adjusted. Gross main-job earnings, not take-home pay, a panel of identical workers, individual raises or a household inflation measure.
- Evidence passage
- Technical Note: estimates and Definitions: Usual weekly earnings, Wage and salary workers, Full-time workers.
- As of
- 2026-10-21
- Limit
- The full-time median excludes part-time and self-employed people and does not establish hours worked by each respondent.
Retrieved 2026-10-21T20:02:07.265Z · U.S. Bureau of Labor Statistics
CPS sample estimates have sampling and nonsampling error; changing worker composition can change a median. Published rounded growth rates are not personal outcomes or a causal policy test.
4.Claim 4Supported
BLS explains that changing subgroup weights or the shape of the earnings distribution can move an overall median differently from subgroup medians.
- Scope
- United States, third-quarter 2026 usual weekly earnings of full-time wage and salary workers; October 21 BLS release. Year-over-year comparisons are not seasonally adjusted. Gross main-job earnings, not take-home pay, a panel of identical workers, individual raises or a household inflation measure.
- Evidence passage
- Definitions: Medians (and other quantiles), paragraph beginning Changes over time.
- As of
- 2026-10-21
- Limit
- Possible explanation, not proof that composition caused this quarter’s change.
Retrieved 2026-10-21T20:02:07.265Z · U.S. Bureau of Labor Statistics
CPS sample estimates have sampling and nonsampling error; changing worker composition can change a median. Published rounded growth rates are not personal outcomes or a causal policy test.
5.Claim 5Supported
The earnings estimates use one-fourth of the monthly CPS sample of about 60,000 eligible households; BLS notes sampling and nonsampling error and generally uses 90% confidence.
- Scope
- United States, third-quarter 2026 usual weekly earnings of full-time wage and salary workers; October 21 BLS release. Year-over-year comparisons are not seasonally adjusted. Gross main-job earnings, not take-home pay, a panel of identical workers, individual raises or a household inflation measure.
- Evidence passage
- Technical Note opening; Reliability section.
- As of
- 2026-10-21
- Limit
- No release-specific standard error or significance test was computed for this story. The survey is not all workers interviewed.
Retrieved 2026-10-21T20:02:07.265Z · U.S. Bureau of Labor Statistics
CPS sample estimates have sampling and nonsampling error; changing worker composition can change a median. Published rounded growth rates are not personal outcomes or a causal policy test.
What remains open.
- No individual worker panel, take-home-pay calculation or local household price basket.
- No release-specific uncertainty interval or significance test computed; sampling and nonsampling error remain.
- The record lists composition as a possible reason medians move; it does not identify this quarter’s cause. No policy or candidate effect established.
- The BLS original was captured and read, but BLS full-release, summary, table and earnings pages returned access-denied responses in the ordinary-browser help check from this server. Useful help therefore links the separately verified Labor Department wages resource, not an asserted universally accessible BLS page.
A BLS correction or revised matched-period earnings/CPI-U figure, a changed population definition, or evidence changing the comparison; preserve this version and report the correction.
THIS STORY IN TIME
Keep the dates with the story.
- Reported development
- Evidence as of
- First retained publication
- This version published
Publication times are Central. A development date and an evidence date can differ. Missing dates remain unrecorded.