← 2026-10-30 edition · Sourced reporting
Private-industry wage costs rose 3.1%; after inflation, they fell 0.6%
As of 2026-10-30 · Publication details
Year to September 2026; not seasonally adjusted · percent change
Same wage-cost index and year; current versus inflation-adjusted dollars. U.S. private industry, not individual take-home pay.
U.S. private-industry wage-cost index, year to September 2026; not individual pay.
BLS's October 30 release shows private-industry wages and salaries up 3.1% over the year to September, but down 0.6% after inflation. This national wage-cost index does not measure your take-home pay. Compare your own raise over the same period. [1] [2] [3]
Still open: These are national survey estimates; no individual pay, hours, taxes, occupation-specific raise or household inflation basket established. All open questions ↓
For questions about your own pay, use USAGov’s wage-law guide for minimum-wage, overtime and worker-classification resources. Coverage and eligibility vary; the national wage-cost index does not determine an individual raise or legal entitlement. →Read the full story
The reporting question: Did private-industry pay costs keep up with inflation over the year to September?
A raise in dollars can still lose ground
The new September ECI release separates current-dollar growth from inflation-adjusted growth. Both chart entries cover the same private-industry wage-cost measure and 12-month period. They are different dollar bases, not two groups of workers. [1] [2]
Keep the quarter separate
Private-industry wage costs also rose 0.8% over June–September after seasonal adjustment. That three-month figure is not the annual growth rate in the chart. BLS's fixed employment weights limit distortion from shifts between occupations and industries. [4] [3]
Use it as a benchmark, not your pay stub
The index cannot tell you how your hours, taxes, benefits or expenses changed. Check the BLS release below for the dated wage and benefit categories, then compare your own pay over a matching period. We have not established what caused the wage changes. [3] [1] [2]
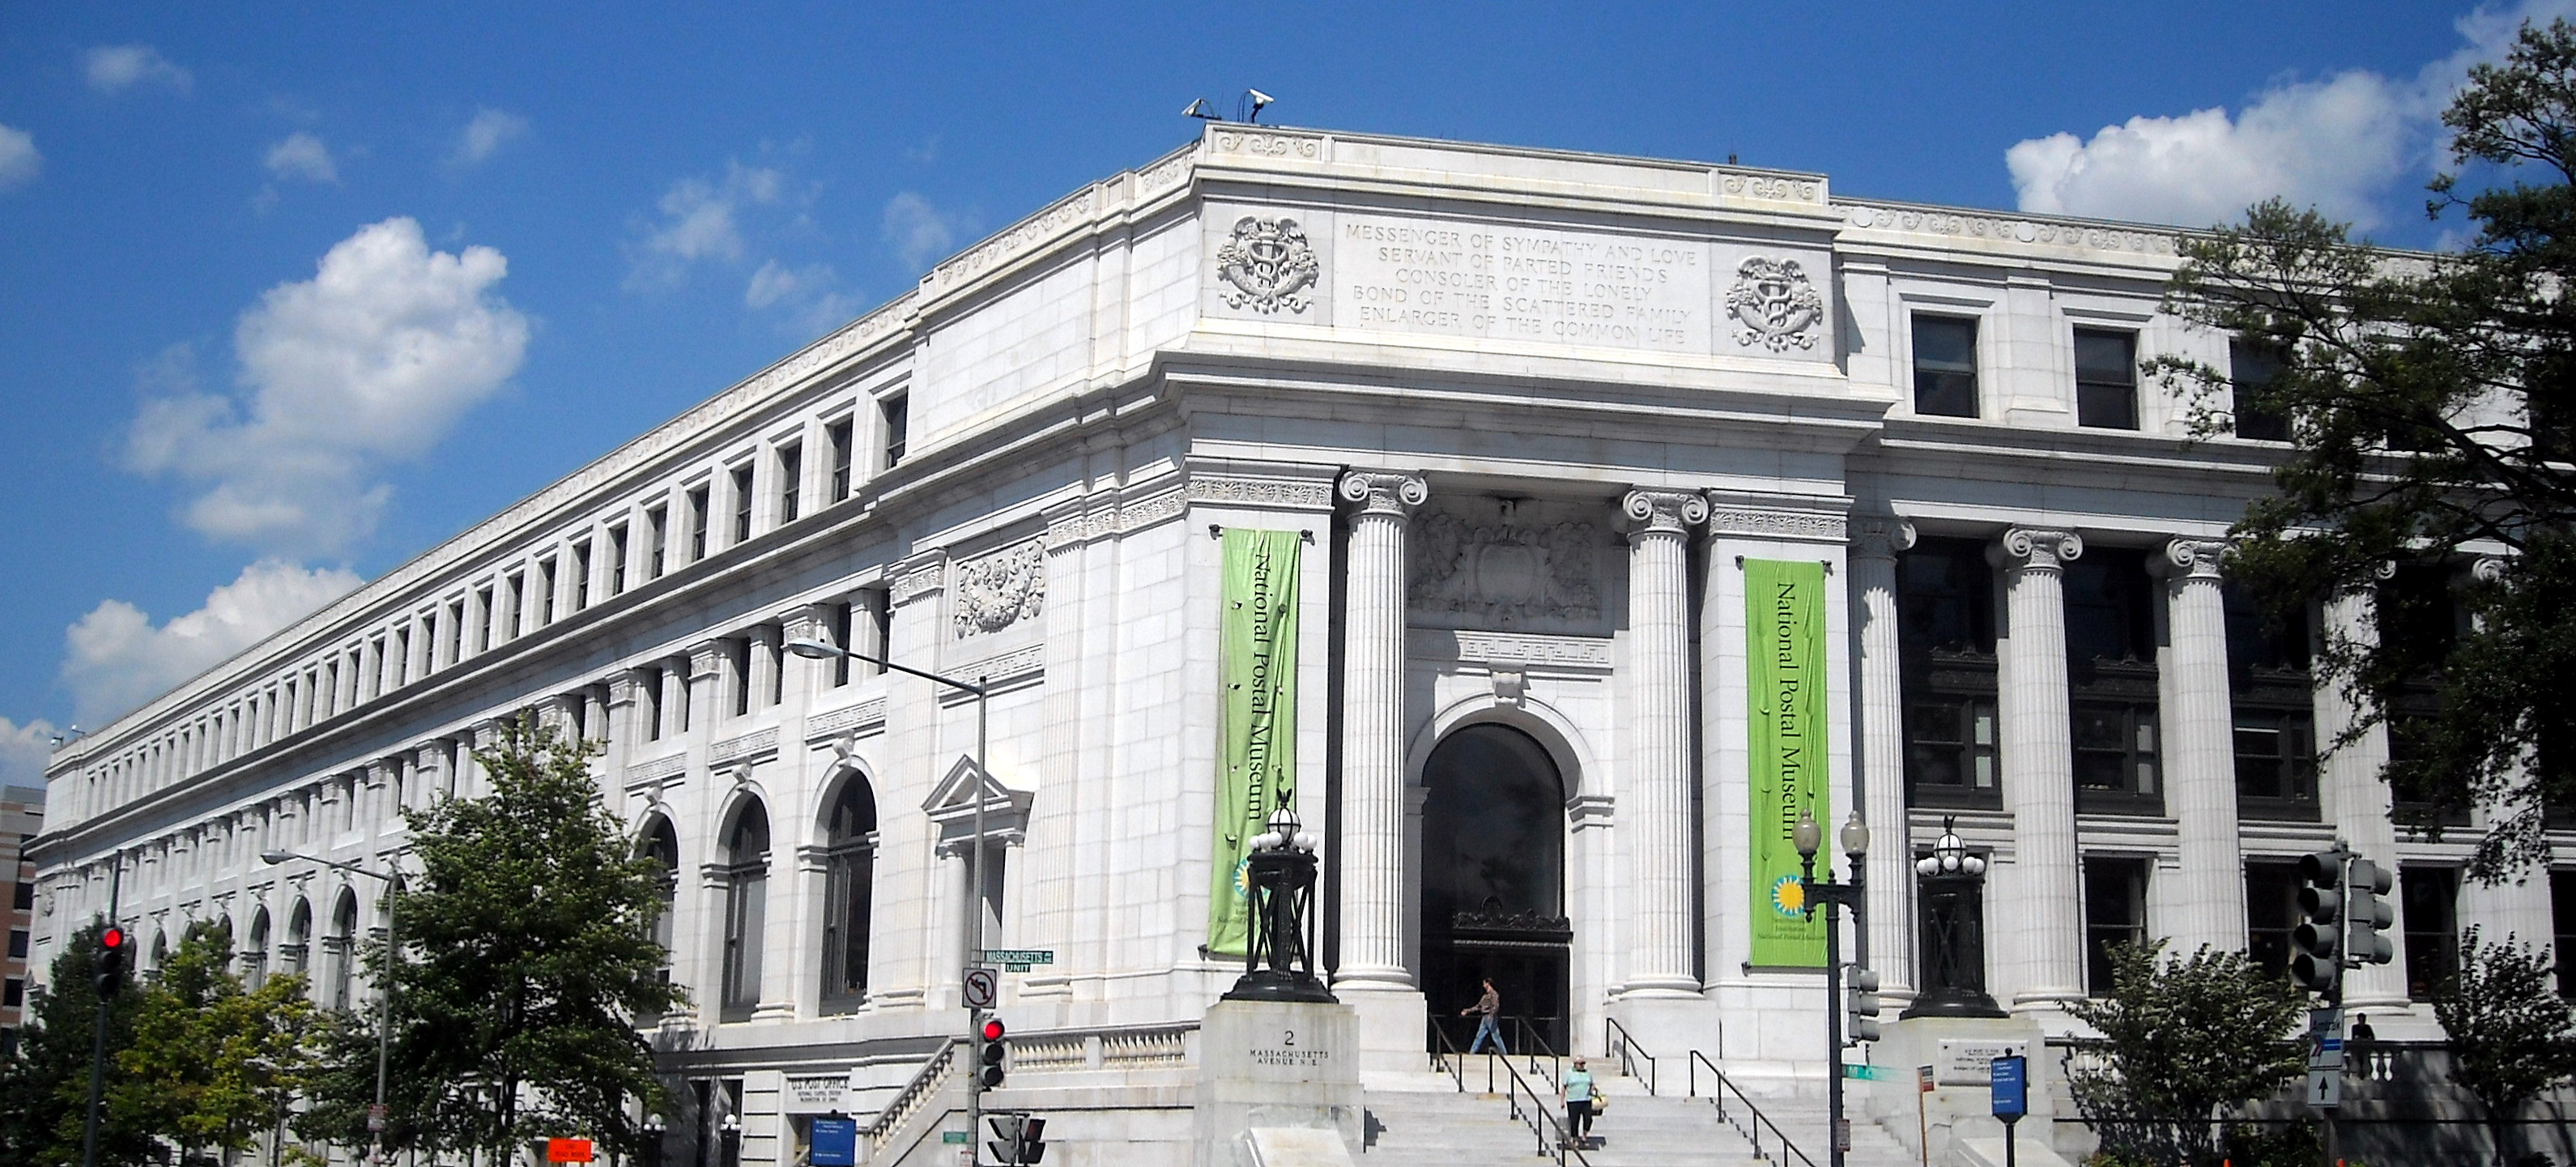
Archive photograph · 2008-08-08 · 2 Massachusetts Avenue NE, Washington, D.C., United States

- 3 source records
- U.S. Bureau of Labor Statistics
How we know4 scoped claims · 3 source recordsView evidence
Each claim keeps its full assertion, date, source passage and limits. Source counts describe records, not independent corroboration.
1.Wage-cost index: +3.1% in current dollarsSupported
BLS reports private-industry wages and salaries increased 3.1% in current dollars over the 12 months ending September 2026, not seasonally adjusted.
- Scope
- U.S. private industry, Employment Cost Index wages and salaries, 12 months ending September 2026; not seasonally adjusted. Current-dollar and constant-dollar percentage changes describe the same wage-cost index on different dollar bases. Not individual take-home pay, hours or household income.
- Evidence passage
- Release paragraph beginning Compensation costs for private industry workers increased 3.4 percent; Table A, private-industry wages and salaries, September 2026 current-dollar 12-month column; Table 9, All workers, September 2026 12-month column.
- As of
- 2026-10-30
- Limit
- Same survey origin; fixed-composition wage costs, not each worker's raise or household income.
Retrieved 2026-10-30T12:37:02.683Z · U.S. Bureau of Labor Statistics
One BLS release; current-dollar and constant-dollar estimates, not independent corroboration or individual pay.
Retrieved 2026-10-30T12:37:03.333Z · U.S. Bureau of Labor Statistics
Same BLS survey as the summary; table is not an independent source.
2.Wage-cost index: −0.6% after inflationSupported
BLS reports inflation-adjusted private-industry wages and salaries decreased 0.6% over the 12 months ending September 2026.
- Scope
- U.S. private industry, Employment Cost Index wages and salaries, 12 months ending September 2026; not seasonally adjusted. Current-dollar and constant-dollar percentage changes describe the same wage-cost index on different dollar bases. Not individual take-home pay, hours or household income.
- Evidence passage
- Release private-industry 12-month paragraph: Inflation-adjusted (constant dollar) wages and salaries decreased 0.6 percent over the year; Table A, private-industry wages and salaries, September 2026 constant-dollar column.
- As of
- 2026-10-30
- Limit
- Published constant-dollar result; no subtraction of mismatched inflation measures, individual loss or personal inflation rate inferred.
Retrieved 2026-10-30T12:37:02.683Z · U.S. Bureau of Labor Statistics
One BLS release; current-dollar and constant-dollar estimates, not independent corroboration or individual pay.
3.An index with fixed employment compositionSupported
BLS says the ECI measures changes in labor costs free from employment shifts among occupations and industries and uses fixed employment weights.
- Scope
- U.S. private industry, Employment Cost Index wages and salaries, 12 months ending September 2026; not seasonally adjusted. Current-dollar and constant-dollar percentage changes describe the same wage-cost index on different dollar bases. Not individual take-home pay, hours or household income.
- Evidence passage
- Technical note, opening paragraph and Employer Costs for Employee Compensation data paragraph contrasting current with fixed weights.
- As of
- 2026-10-30
- Limit
- October 30 methodological context; not a sample-size comparison or a measure of hours, taxes or one household's costs.
Retrieved 2026-10-30T12:38:44.452Z · U.S. Bureau of Labor Statistics
Actual adapter-captured technical note is modified October 30; browser cache showed an older Q2 page. Only the retained October 30 bytes support the method claim; no sample-size comparison made.
4.Quarterly wage growth is a different periodSupported
BLS reports private-industry wages and salaries rose 0.8%, seasonally adjusted, over the three months ending September 2026.
- Scope
- U.S. private-industry wages and salaries, three months June–September 2026; seasonally adjusted, separate from the annual chart.
- Evidence passage
- Release private-industry 3-month paragraph, wages and salaries; quarter June–September 2026.
- As of
- 2026-10-30
- Limit
- Quarterly seasonally adjusted rate is separate from the unadjusted annual chart; do not annualize by multiplication or treat it as annual growth.
Retrieved 2026-10-30T12:37:02.683Z · U.S. Bureau of Labor Statistics
One BLS release; current-dollar and constant-dollar estimates, not independent corroboration or individual pay.
What remains open.
- These are national survey estimates; no individual pay, hours, taxes, occupation-specific raise or household inflation basket established.
- Table 9 and the summary are the same BLS origin, not independent corroboration. September standard-error tables and full survey microdata not captured; no significance claim about differences.
- Browser cache showed an older Q2 technical note; actual adapter capture is dated October 30 and supports the fixed-weight description. Earlier browser sample counts are not used.
- No causal allocation among bargaining, productivity, policy or industry conditions is established.
- The BLS release, table, technical note and linked PDF failed ordinary-reader browser access on October 30, 2026. Original BLS evidence remains captured. USAGov is a separate practical wage-law information route, not a replacement ECI dataset or a determination of individual coverage or entitlement.
Reopen for a corrected source, new original record, materially changed status or independently verified contrary evidence. Preserve earlier versions.
THIS STORY IN TIME
Keep the dates with the story.
- Reported development
- Evidence as of
- First retained publication
- This version published
Publication times are Central. A development date and an evidence date can differ. Missing dates remain unrecorded.