← 2026-10-16 edition · Sourced reporting
Published Oct 16, 2026, 7:00 AM Central · This version Oct 16, 2026, 7:00 AM Central · As of 2026-10-16
NASA’s new El Niño maps track a warmer, higher—and bluer—Pacific
NASA’s October 15 account combines sea-height, temperature and ocean-color views of the 2026 El Niño. The measurements tell different parts of the ocean story. They do not give a local forecast of this winter’s snow, storms or bills. [1] [2] [3] [4]
Use National Weather Service winter-safety guidance for preparation, and check current local watches and warnings separately. NASA’s ocean maps are not a local winter forecast. →NASA’s October 15 account of 2025–2026 equatorial Pacific satellite and ocean observations. Sea height, temperature and ocean color are different measurements. This article does not issue a local winter, snow, flood or household-energy forecast.
- 2 source records
- NASA
- National Weather Service
Still open: NASA’s 83% strongest-since-1950 wording was not reconciled with the underlying CPC forecast and is excluded from the article and graphic. All open questions ↓
Reporting question · As of 2026-10-16
The question: What do NASA’s October 15 ocean maps show, and what do they leave unresolved?
NASA’s October 15 account of 2025–2026 equatorial Pacific satellite and ocean observations. Sea height, temperature and ocean color are different measurements. This article does not issue a local winter, snow, flood or household-energy forecast.
Ocean color
PACE: apparent visible wavelength, interpreted with phytoplankton and upwelling context.
[3]NASA’s 2025–2026 Pacific comparisons, published October 15. These cards have no shared numerical scale or step order and make no local-weather or fishery-loss prediction.
Read the process as a table
| Component | Meaning | Evidence |
|---|---|---|
| Sea height | Sentinel-6 altimetry: a height anomaly, not temperature. | [1] |
| Surface temperature | Satellites, buoys and ships: a separate measure of ocean warmth. | [2] |
| Ocean color | PACE: apparent visible wavelength, interpreted with phytoplankton and upwelling context. | [3] |
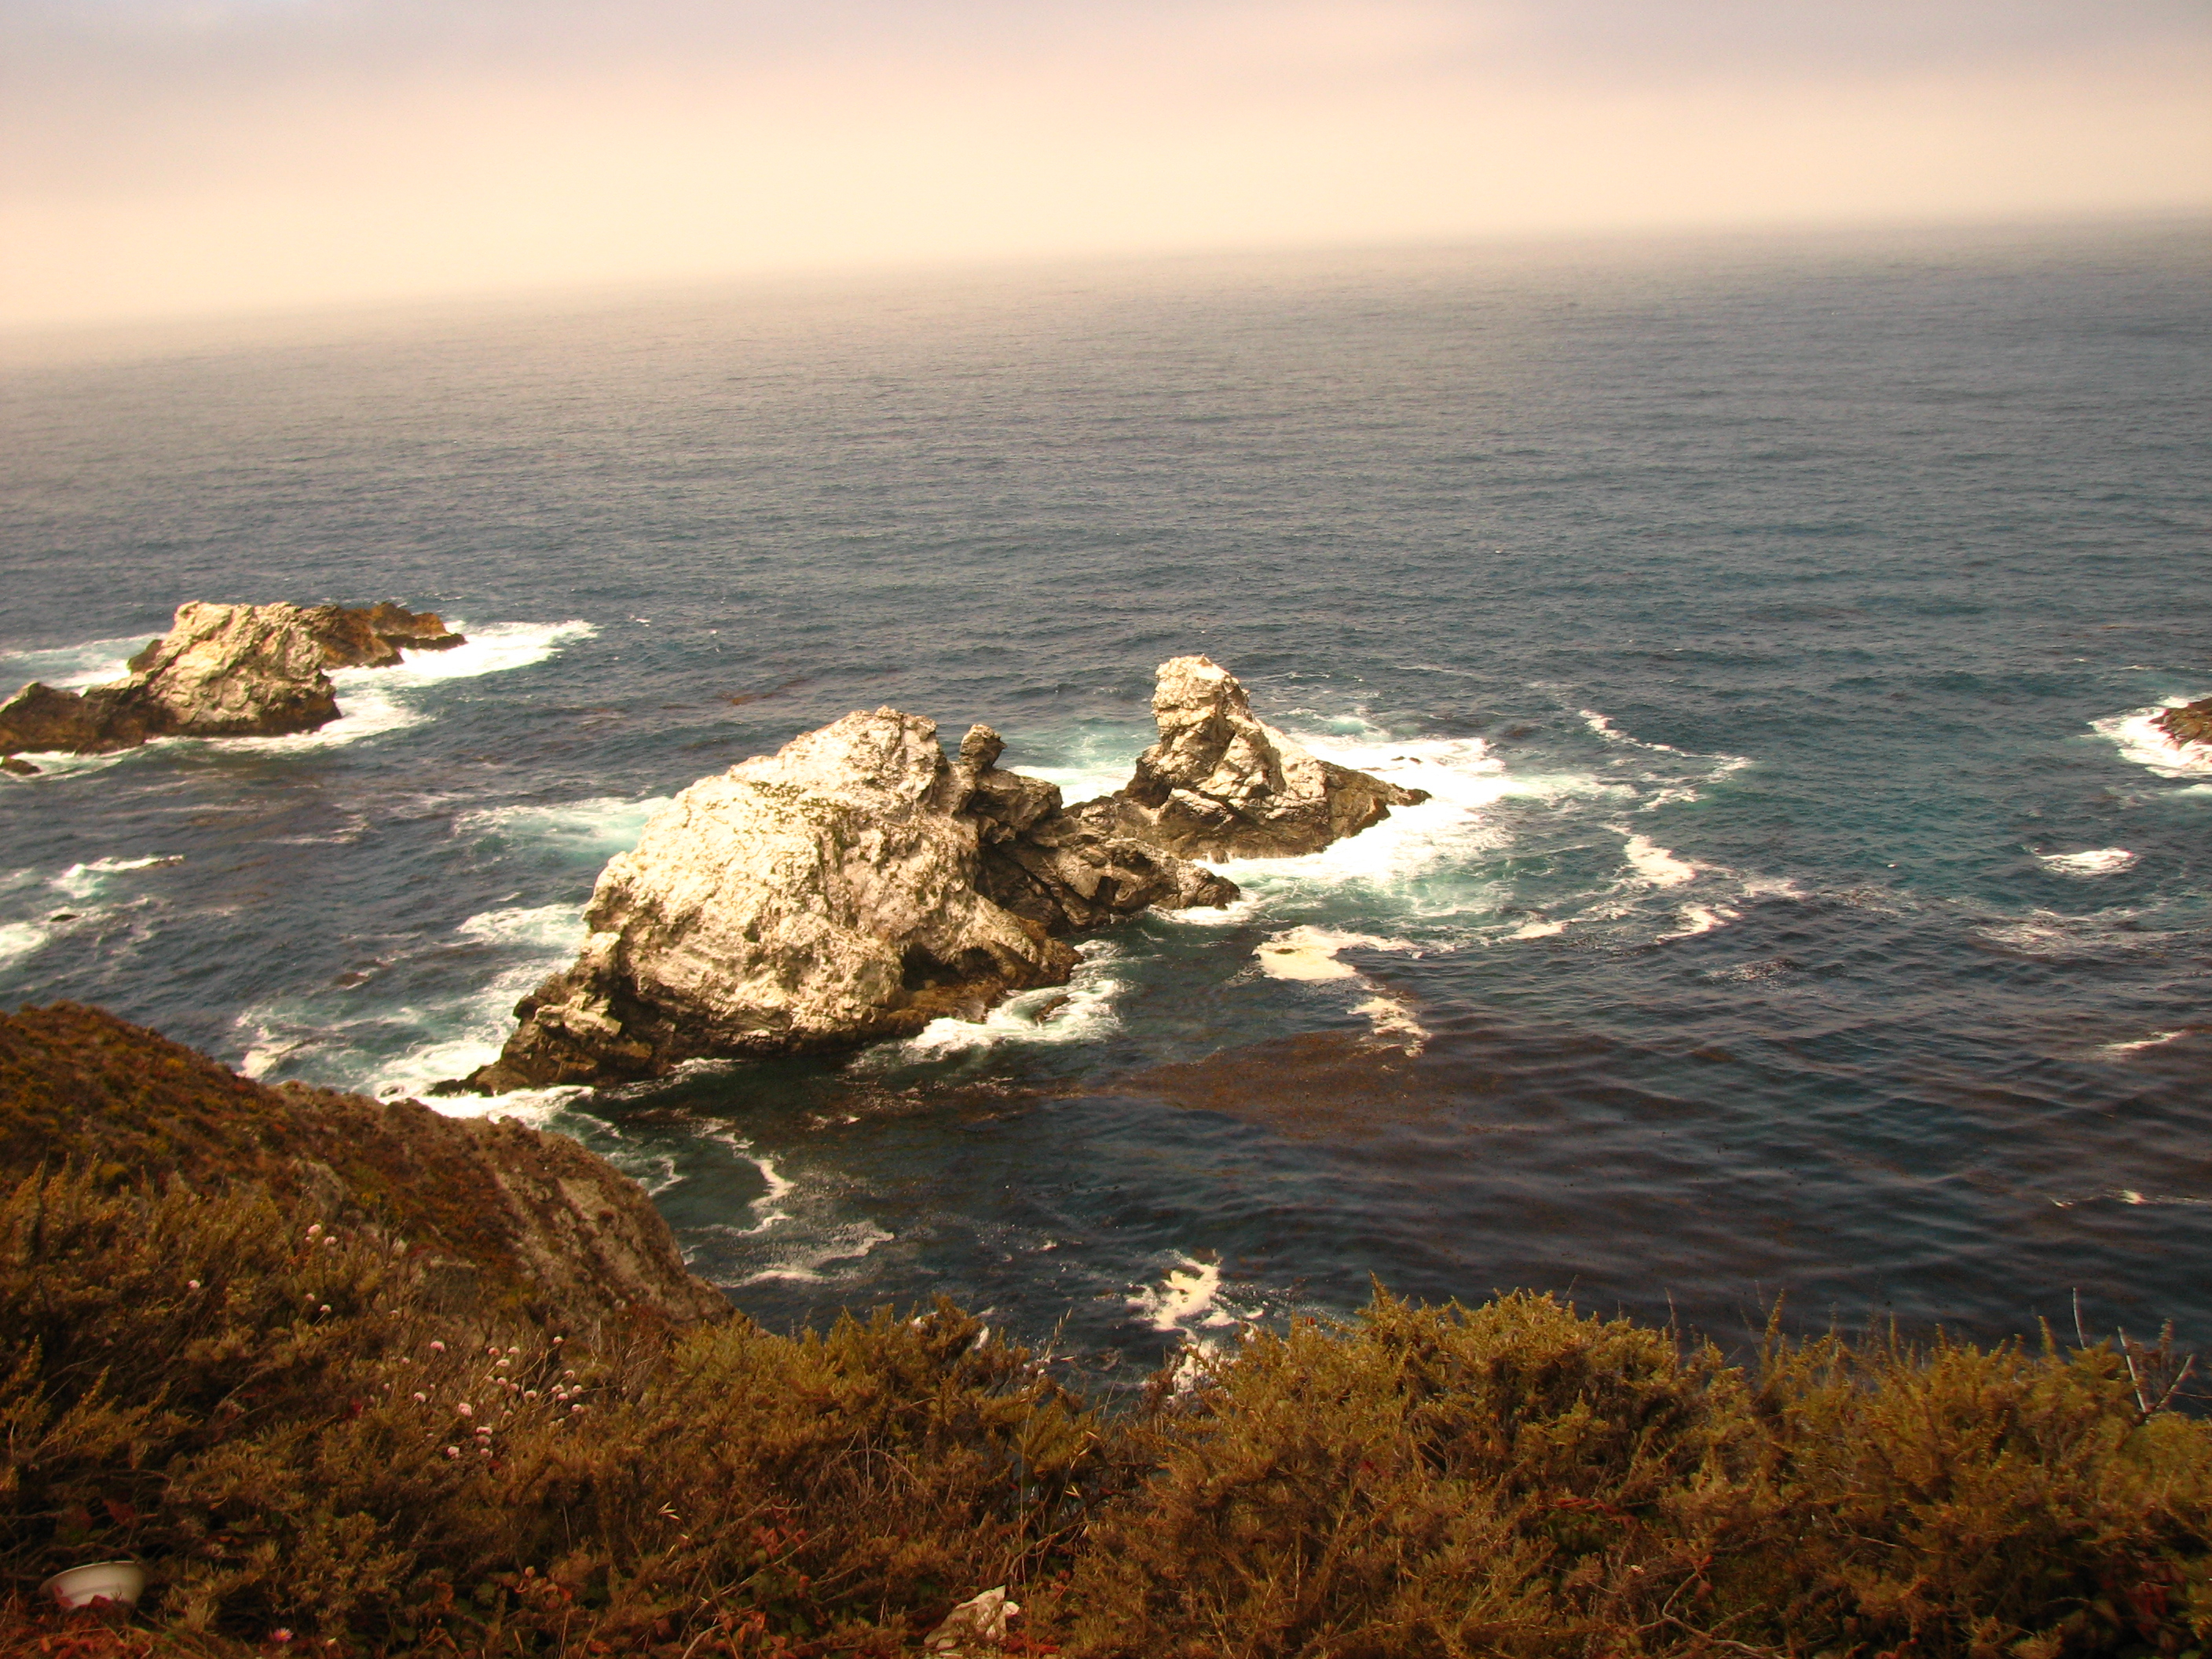
Archive photograph · 2007-07-30 · Pacific coast, American West; exact location not supplied in source metadata

Understand the story.
Watch the water move
Sentinel-6 measures sea-surface height. NASA’s comparison tracks warm water moving across the Pacific and explains how its movement interacts with winds. The map’s height colors describe ocean height anomalies. [1]
Read a different instrument
The temperature view combines satellites with buoys and ship sensors. Its expanding warm band is a separate observation from height. Different measurement types need their own labels; a red patch in one map does not share the other map’s units. [2]
The ocean’s color changes too
PACE adds a view of ocean color. NASA interprets the bluer equatorial area as fewer phytoplankton and explains how weaker nutrient upwelling can contribute. This does not count fish or measure a particular fishing community’s losses. [3]
Use weather guidance for weather decisions
Keep the ocean observations separate from local planning. The linked National Weather Service resource explains winter preparation. No local seasonal snowfall total or current warning is supplied by the three ocean cards. [1] [2] [3] [4]
How we know4 scoped claims · 2 source recordsView evidence
Each claim keeps its full assertion, date, source passage and limits. Source counts describe records, not independent corroboration.
1.Height is one signalSupported
NASA’s new account compares 2025 and 2026 sea-surface-height anomalies using Sentinel-6 altimetry and describes warm water moving east through the Pacific.
- Scope
- NASA’s October 15 account of 2025–2026 equatorial Pacific satellite and ocean observations. Sea height, temperature and ocean color are different measurements. This article does not issue a local winter, snow, flood or household-energy forecast.
- Evidence passage
- Sea surface height in flux → map caption and Kelvin-wave discussion.
- As of
- 2026-10-16
- Limit
- An ocean observation and agency explanation, not a local storm prediction. Height anomalies are not temperature units.
Retrieved 2026-10-16T10:03:10.073Z · NASA
Agency scientific communication and visualizations; instrument data and explanation are attributed. Underlying numerical datasets and the independent seasonal forecast were not ingested.
2.Temperature is anotherSupported
NASA’s separate temperature comparison uses satellite instruments, buoys and ship sensors to show the equatorial band of warmer-than-normal surface water expanding in 2026.
- Scope
- NASA’s October 15 account of 2025–2026 equatorial Pacific satellite and ocean observations. Sea height, temperature and ocean color are different measurements. This article does not issue a local winter, snow, flood or household-energy forecast.
- Evidence passage
- Warming Pacific waters → map caption and following paragraphs.
- As of
- 2026-10-16
- Limit
- Different measurement from sea height. We have not reconstructed the anomalies or their long-term baseline from raw datasets.
Retrieved 2026-10-16T10:03:10.073Z · NASA
Agency scientific communication and visualizations; instrument data and explanation are attributed. Underlying numerical datasets and the independent seasonal forecast were not ingested.
3.Color adds biological contextAttributed
NASA says PACE’s Ocean Color Instrument supplies the apparent-visible-wavelength comparison. A bluer equatorial area indicates fewer phytoplankton; the agency describes reduced nutrient upwelling as an expected El Niño mechanism.
- Scope
- NASA’s October 15 account of 2025–2026 equatorial Pacific satellite and ocean observations. Sea height, temperature and ocean color are different measurements. This article does not issue a local winter, snow, flood or household-energy forecast.
- Evidence passage
- Ocean gets bluer → PACE caption, phytoplankton and upwelling paragraphs.
- As of
- 2026-10-16
- Limit
- Instrument-derived interpretation, not a direct species census or quantified fishery loss. NASA’s maps compare different ocean properties, not interchangeable scales.
Retrieved 2026-10-16T10:03:10.073Z · NASA
Agency scientific communication and visualizations; instrument data and explanation are attributed. Underlying numerical datasets and the independent seasonal forecast were not ingested.
4.Preparation has a separate destinationSupported
The National Weather Service provides winter-weather safety guidance, including actions before, during and after a storm.
- Scope
- NASA’s October 15 account of 2025–2026 equatorial Pacific satellite and ocean observations. Sea height, temperature and ocean color are different measurements. This article does not issue a local winter, snow, flood or household-energy forecast.
- Evidence passage
- Winter Weather Safety → page navigation and preparedness links.
- As of
- 2026-10-16
- Limit
- General preparation; a local current watch or warning must be checked separately.
Retrieved 2026-10-16T10:06:40.319Z · National Weather Service
Background preparation resource, checked October 16; not an October 15 seasonal prediction.
What remains open.
- NASA’s 83% strongest-since-1950 wording was not reconciled with the underlying CPC forecast and is excluded from the article and graphic.
- NOAA’s new winter-outlook capture returned HTTP 403; CPC paths are outside the installed capture family. No regional seasonal probability or snow forecast is asserted.
- Raw satellite datasets, exact anomaly baselines and independent biological validation were not ingested.
A newer or corrected original that changes the central finding, scope, operational status or applicable dates requires a separately identified revision and renewed source review.
THIS STORY IN TIME
Keep the dates with the story.
- Reported development
- Evidence as of
- First retained publication
- This version published
Publication times are Central. A development date and an evidence date can differ. Missing dates remain unrecorded.