← 2026-11-02 edition · Sourced reporting
AAA’s gas average is down 11.64 cents in a week, still above a year ago
As of 2026-11-02 · Publication details
AAA November 2, 2026 · national regular gasoline; station prices vary · US dollars/gallon
United States national regular-grade retail gasoline average, dollars per gallon · AAA table dated November 2, 2026. Current, week-ago and year-ago table observations; not a station quote or a household spending measure.
AAA’s November 2 table puts national regular gasoline at $4.1694 a gallon: 11.64 cents below its week-ago value, but $1.1333 above its year-ago value. Your station price and gallons bought can differ; the national average does not measure your bill. [1] [4] [5]
Still open: Detailed weighting, station-level price and actual household purchases are not established. All open questions ↓
Check AAA’s displayed observation date and regular-grade national table; its state options provide a separate regional comparison. A state or national average is not a guaranteed station price. →Read the full story
The reporting question: How far has the national gas average fallen—and what does that tell you about your fill-up?
A weekly drop, a different yearly comparison
The national regular average in the new table is $4.1694 a gallon, compared with $4.2858 a week ago and $3.0361 a year ago. Comparing the same grade keeps the calculation useful. Diesel, premium and E85 are separate series and are not mixed into these numbers. [1] [2] [3]
The average cannot tell you your saving
The weekly difference is $0.1164 for each gallon in this national series. That calculation does not establish what any driver paid or saved: a personal bill depends on the station price and quantity purchased. No actual household purchase or explanation for the price change is established here. [1] [2] [4]
Use the date and grade when comparing
AAA describes a daily OPIS service surveying up to 120,000 stations. That ceiling is not a published count of valid responses on November 2. Check the current table’s date, use regular-grade comparisons consistently, and consult the site’s state comparison when looking beyond the national figure. Detailed weighting and a station-specific outcome are outside this report. [1] [6]
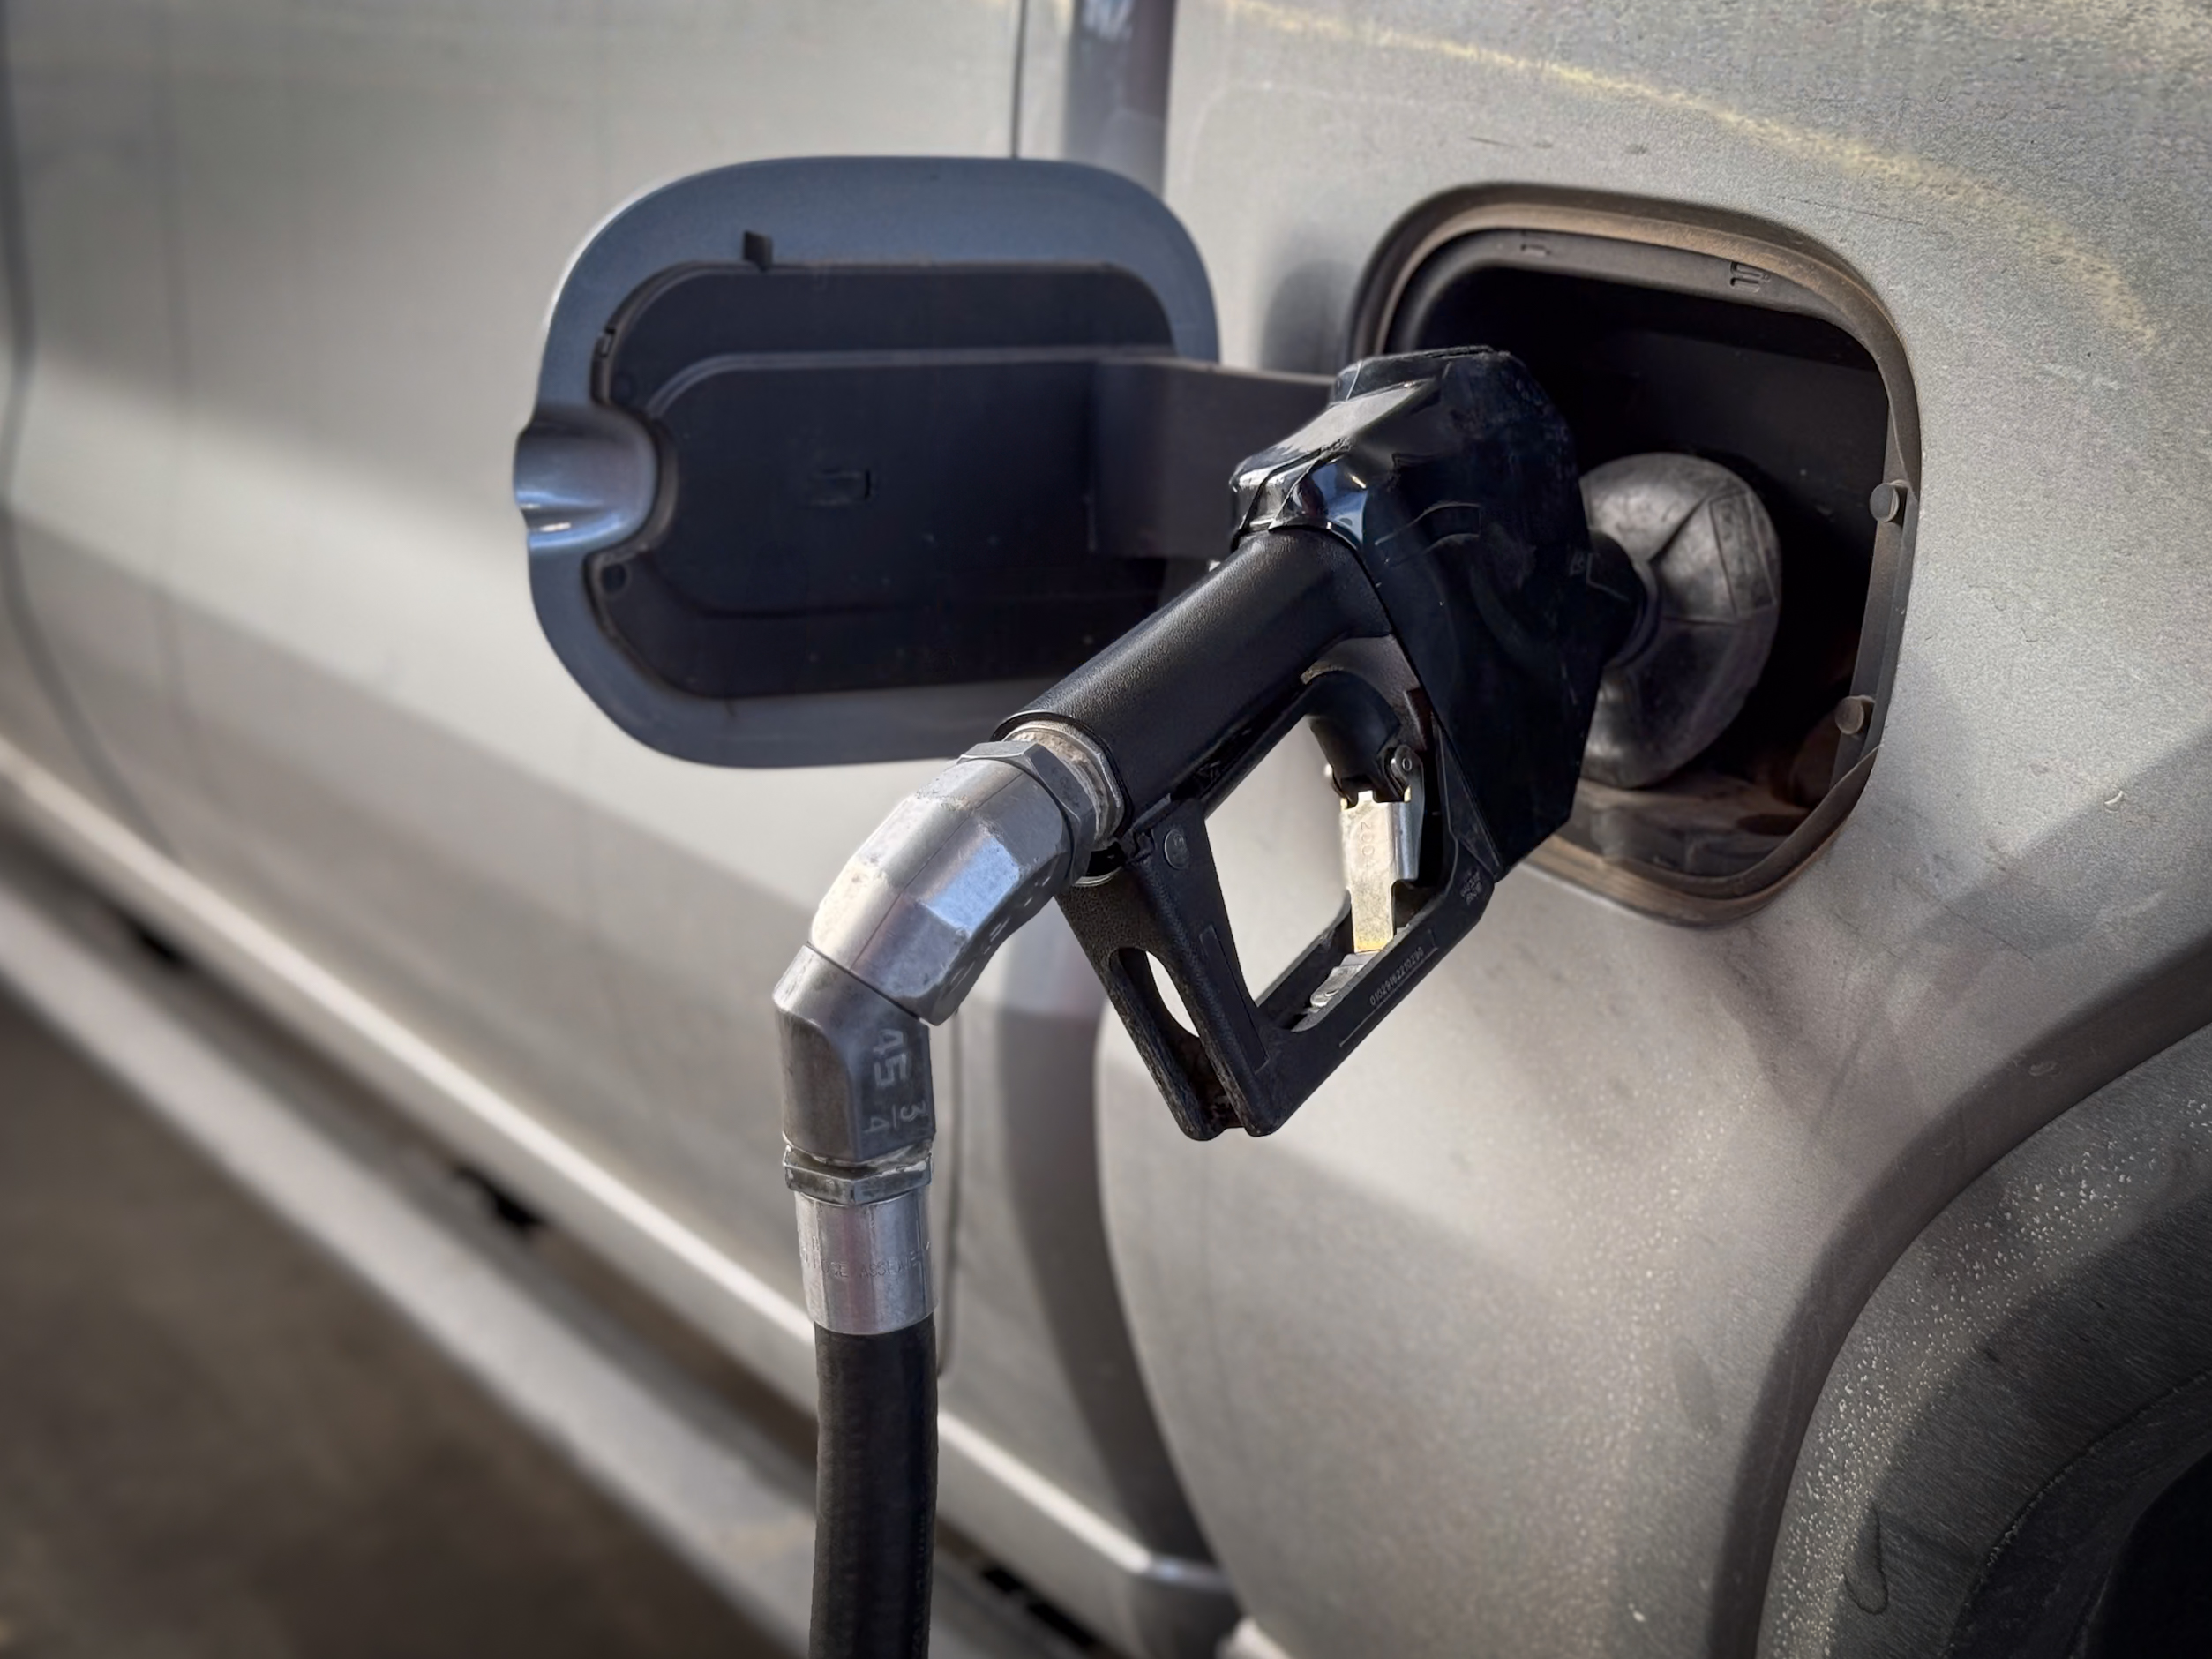
Archive photograph · 2025-02-04 · Location not established in retained Commons description

- 2 source records
- AAA — daily national gasoline table
- AAA — survey description
How we know6 scoped claims · 2 source recordsView evidence
Each claim keeps its full assertion, date, source passage and limits. Source counts describe records, not independent corroboration.
1.Current regular averageAttributed
AAA’s table dated November 2 lists the national regular gasoline average at $4.1694 per gallon.
- Scope
- United States national regular-grade retail gasoline average, dollars per gallon · AAA table dated November 2, 2026. Current, week-ago and year-ago table observations; not a station quote or a household spending measure.
- Evidence passage
- National average gas prices > Regular > Current Avg.; page Price as of 11/2/26.
- As of
- 2026-11-02
- Limit
- National regular average, not a promise at any station.
Retrieved 2026-11-02T09:27:58.799Z · AAA — daily national gasoline table
The displayed daily observation date is not an invented publication timestamp. No station-level prices, weighting detail or causal model is established.
2.Week-ago regular averageAttributed
The same table lists its week-ago national regular average at $4.2858 per gallon.
- Scope
- United States national regular-grade retail gasoline average, dollars per gallon · AAA table dated November 2, 2026. Current, week-ago and year-ago table observations; not a station quote or a household spending measure.
- Evidence passage
- National average gas prices > Regular > Week Ago Avg.
- As of
- 2026-11-02
- Limit
- The week-ago comparison remains the table’s own dated series; no other grade substituted.
Retrieved 2026-11-02T09:27:58.799Z · AAA — daily national gasoline table
The displayed daily observation date is not an invented publication timestamp. No station-level prices, weighting detail or causal model is established.
3.Year-ago regular averageAttributed
The table lists its year-ago national regular average at $3.0361 per gallon.
- Scope
- United States national regular-grade retail gasoline average, dollars per gallon · AAA table dated November 2, 2026. Current, week-ago and year-ago table observations; not a station quote or a household spending measure.
- Evidence passage
- National average gas prices > Regular > Year Ago Avg.
- As of
- 2026-11-02
- Limit
- Not inflation adjusted and not a measure of other consumer prices.
Retrieved 2026-11-02T09:27:58.799Z · AAA — daily national gasoline table
The displayed daily observation date is not an invented publication timestamp. No station-level prices, weighting detail or causal model is established.
4.11.64 cents below week agoSupported
Subtracting the table’s week-ago value from its current value gives a decline of $0.1164 per gallon, or 11.64 cents.
- Scope
- United States national regular-grade retail gasoline average, dollars per gallon · AAA table dated November 2, 2026. Current, week-ago and year-ago table observations; not a station quote or a household spending measure.
- Evidence passage
- Arithmetic from Regular Current Avg. 4.1694 minus Week Ago Avg. 4.2858 = -0.1164 dollars per gallon.
- As of
- 2026-11-02
- Limit
- Arithmetic only; no attribution of cause or actual household savings.
Retrieved 2026-11-02T09:27:58.799Z · AAA — daily national gasoline table
The displayed daily observation date is not an invented publication timestamp. No station-level prices, weighting detail or causal model is established.
5.$1.1333 above year agoSupported
The current value is $1.1333 per gallon above the year-ago value in the same table.
- Scope
- United States national regular-grade retail gasoline average, dollars per gallon · AAA table dated November 2, 2026. Current, week-ago and year-ago table observations; not a station quote or a household spending measure.
- Evidence passage
- Arithmetic from Regular Current Avg. 4.1694 minus Year Ago Avg. 3.0361 = 1.1333 dollars per gallon.
- As of
- 2026-11-02
- Limit
- Different time comparisons can point in different directions; no forecast.
Retrieved 2026-11-02T09:27:58.799Z · AAA — daily national gasoline table
The displayed daily observation date is not an invented publication timestamp. No station-level prices, weighting detail or causal model is established.
6.Daily survey, bounded reachAttributed
AAA says OPIS updates its price service daily using a survey of up to 120,000 stations.
- Scope
- United States national regular-grade retail gasoline average, dollars per gallon · AAA table dated November 2, 2026. Current, week-ago and year-ago table observations; not a station quote or a household spending measure.
- Evidence passage
- About AAA > first paragraph describing daily OPIS updates and station survey.
- As of
- 2026-11-02
- Limit
- Up to is a ceiling, not exactly120,000 valid responses. Source does not supply detailed weighting, current response count or station-level outcomes.
Retrieved 2026-11-02T09:27:58.823Z · AAA — survey description
Undated methodology page says up to120,000 stations; no daily responding count, detailed weighting or household representativeness is supplied. The page retains copyright/use restrictions; story uses factual observations and independent arithmetic, not protected narrative or an implied data license.
What remains open.
- Detailed weighting, station-level price and actual household purchases are not established.
- AAA’s site has copyright/use restrictions. No public reproduction of captured body, promotional narrative or implied commercial dataset license is proposed; exact rights review remains pending.
- Separate exact-source review and publisher browser/state-selector/help/photo/mobile tasks pending.
An updated original record, correction or evidence outside the stated scope would reopen the affected claims and visual.
THIS STORY IN TIME
Keep the dates with the story.
- Reported development
- Evidence as of
- First retained publication
- This version published
Publication times are Central. A development date and an evidence date can differ. Missing dates remain unrecorded.