← 2026-10-28 edition · Sourced reporting
WMO reports record CO₂ accumulation despite a smaller annual rise
As of 2026-10-28 · Publication details
2023–2025 · ppm added per one-year interval
WMO-attributed global CO₂ concentration increases reported October 27 by UN News. Equal one-year intervals; additions, not emissions tonnes or a 2026 forecast.
UN News October 27 account of WMO’s 2025 global annual atmospheric measurements. Concentration in parts per million differs from annual emissions. No local weather attribution, personal exposure guidance or observed 2026 total.
WMO reports a record 426.8 ppm global CO₂ concentration for 2025. The annual increase was smaller than the previous year’s but still positive. Slower accumulation differs from a fall in the atmospheric total. [1] [2] [3] [4]
Still open: 2025 global mean; not a station reading, health threshold or independently reproduced dataset. All open questions ↓
Read the measurement explanation before comparing concentration with annual emissions →Read the full story
The reporting question: What changed in the atmosphere—and how is that different from emissions?
A new measurement account
UN News’s October 27 briefing report gives WMO’s global annual average, not a live station reading. The underlying bulletin and station series remain uncaptured, so the 426.8 ppm figure is attributed rather than independently reconstructed here. [1]
A smaller rise still adds gas
The reported addition fell from 3.5 ppm in 2023–24 to 2.8 ppm in 2024–25. Both describe equal one-year intervals and both are increases. A smaller addition can coexist with a higher accumulated total. [2]
Check which quantity a claim uses
The bulletin measures gas accumulated in the atmosphere, not new annual emissions. Land and ocean absorption also matters. These figures cannot alone evaluate one country’s policy or attribute a local disaster. [3]
Use the distinction in the next headline
Check the quantity, period and geography before reading a climate claim as progress or failure. The linked account explains the measurements and WMO’s call for continued atmospheric monitoring as energy systems change. [4]
Archive photograph · 2017-06-18 · Mauna Loa, Hawaii, United States
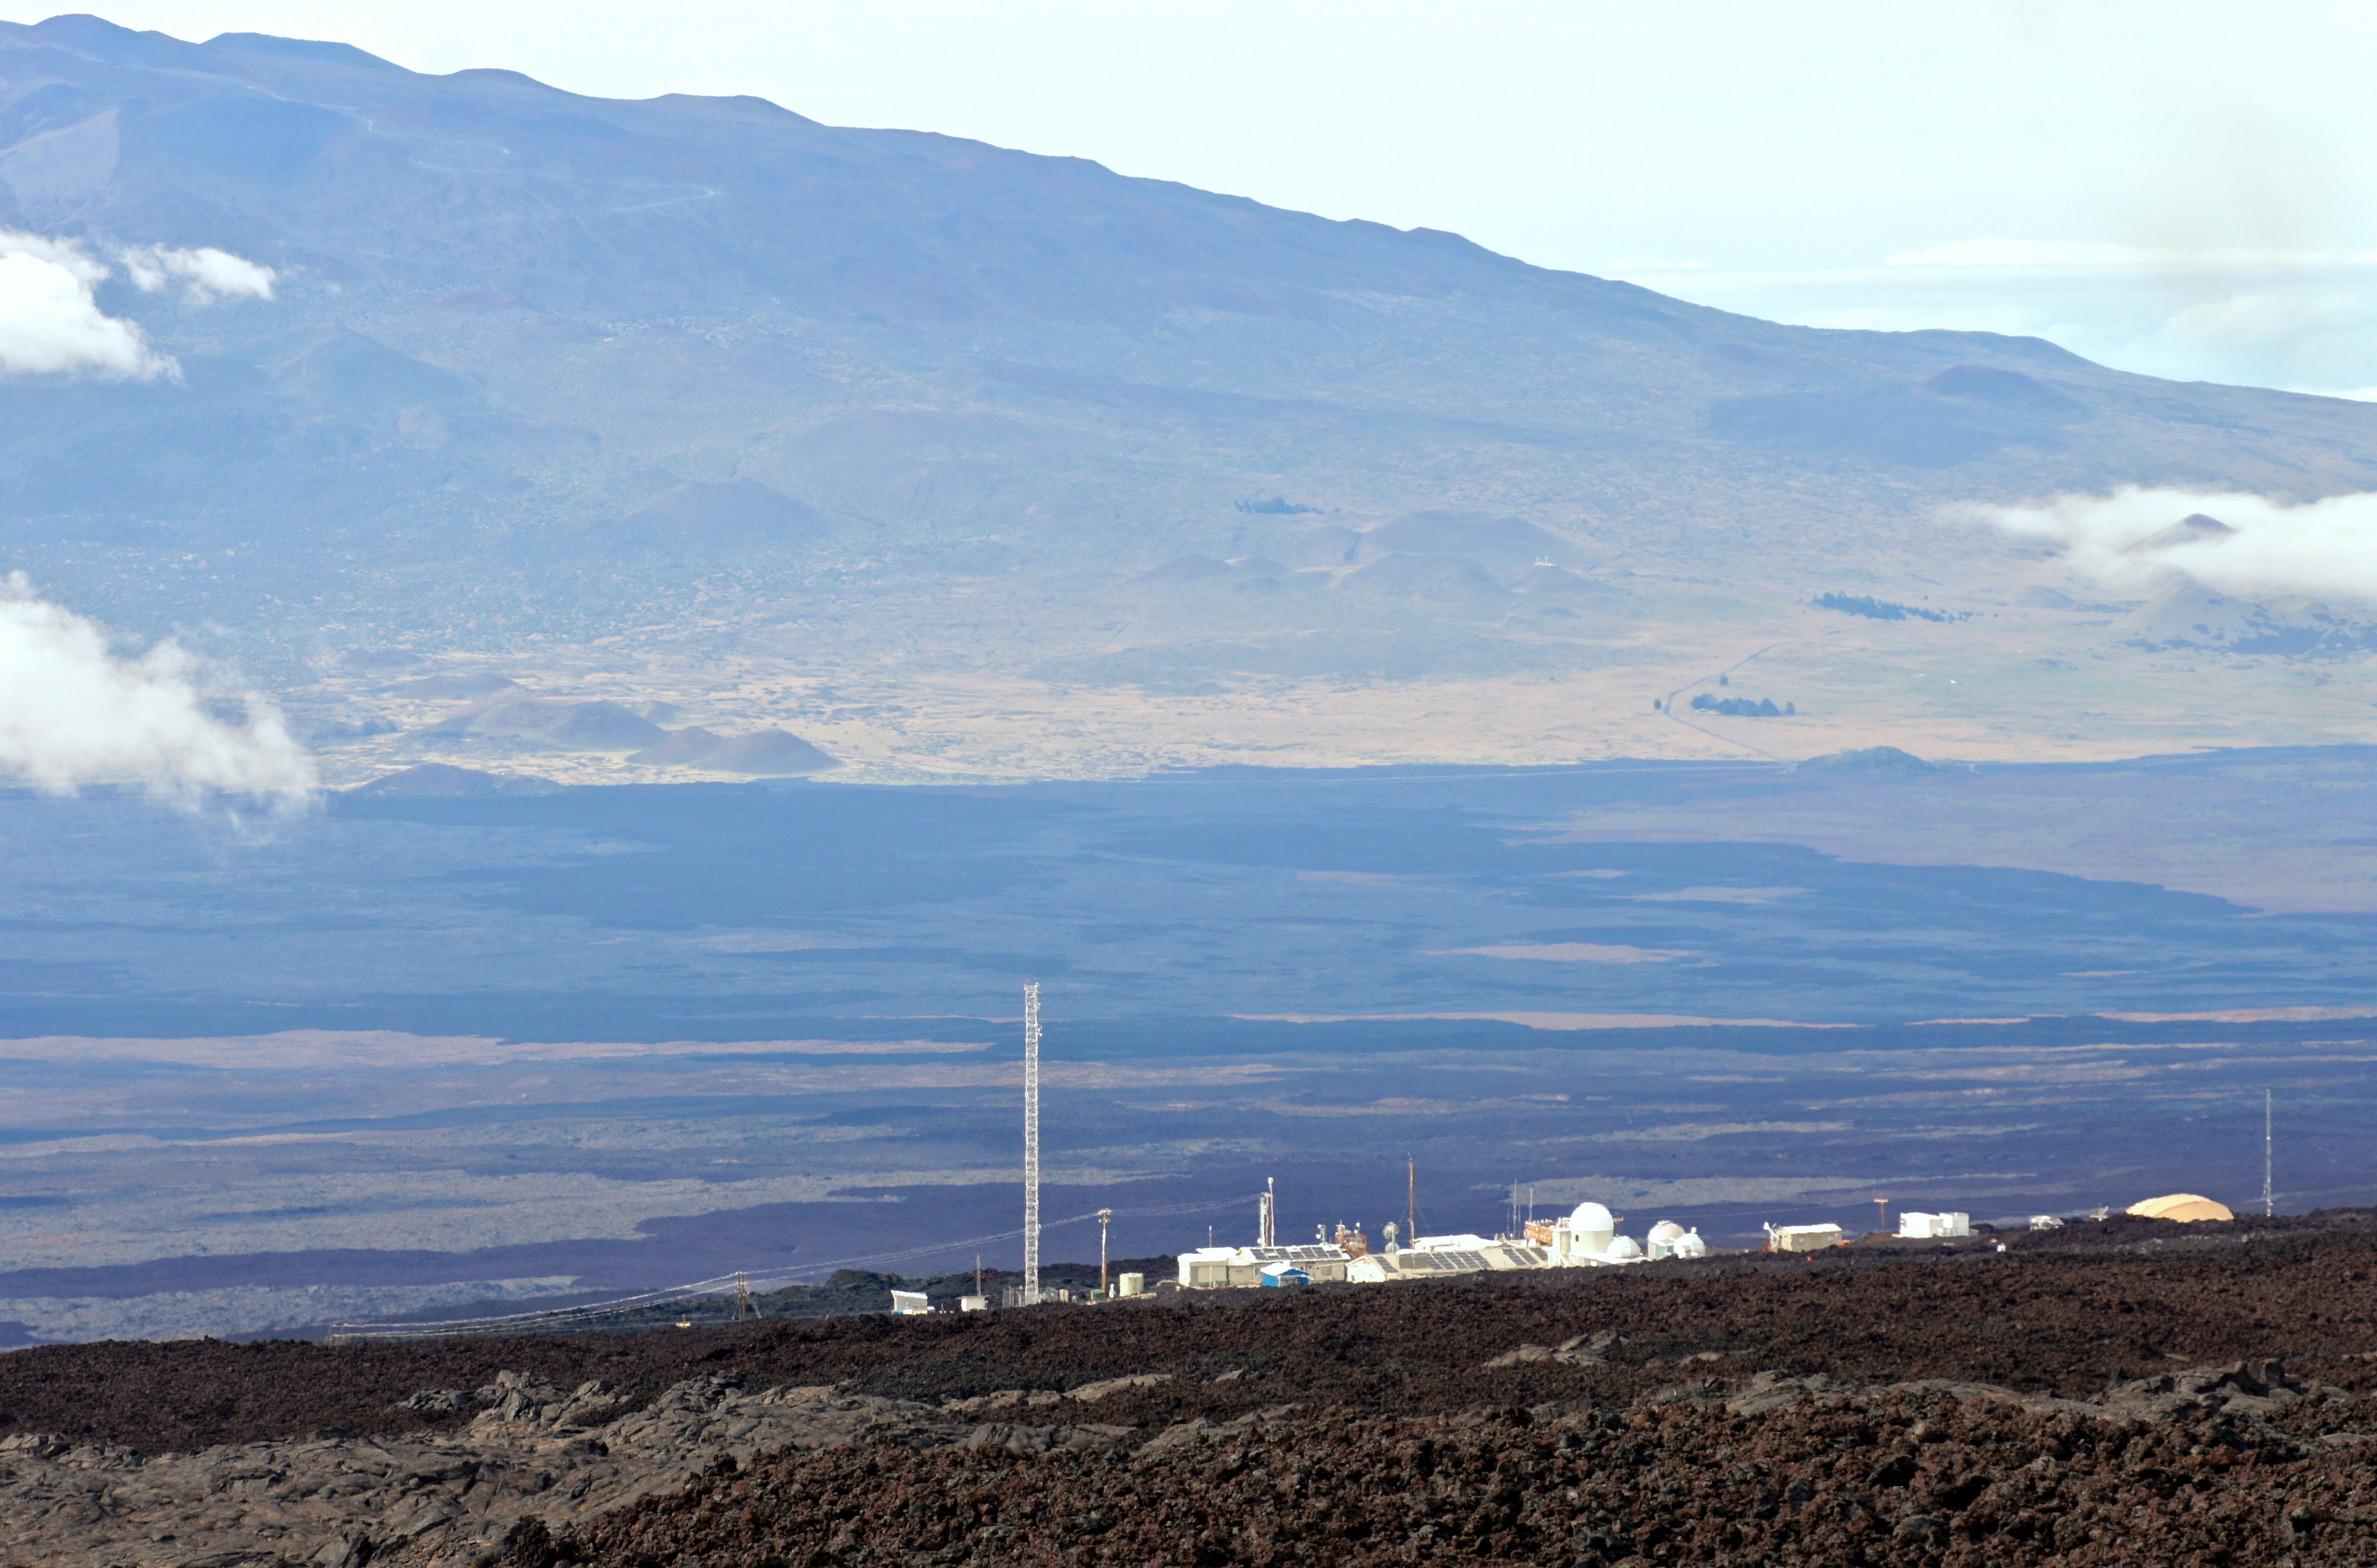

- 1 source record
- Original reporting
- UN News, reporting WMO
How we know4 scoped claims · 1 source recordView evidence
Each claim keeps its full assertion, date, source passage and limits. Source counts describe records, not independent corroboration.
1.A new measurement accountAttributed
UN News’s October 27 briefing report gives WMO’s global annual average, not a live station reading. The underlying bulletin and station series remain uncaptured, so the 426.8 ppm figure is attributed rather than independently reconstructed here.
- Scope
- UN News October 27 account of WMO’s 2025 global annual atmospheric measurements. Concentration in parts per million differs from annual emissions. No local weather attribution, personal exposure guidance or observed 2026 total.
- Evidence passage
- Opening Greenhouse Gas Bulletin paragraphs.
- As of
- 2026-10-28
- Limit
- 2025 global mean; not a station reading, health threshold or independently reproduced dataset.
Retrieved 2026-10-28T11:29:41.232Z · UN News, reporting WMO
Supports only the cited visible passages. Retrieval does not establish accuracy, independence, completeness or downstream effects.
2.A smaller rise still adds gasAttributed
The reported addition fell from 3.5 ppm in 2023–24 to 2.8 ppm in 2024–25. Both describe equal one-year intervals and both are increases. A smaller addition can coexist with a higher accumulated total.
- Scope
- UN News October 27 account of WMO’s 2025 global annual atmospheric measurements. Concentration in parts per million differs from annual emissions. No local weather attribution, personal exposure guidance or observed 2026 total.
- Evidence passage
- “El Niño accelerator”, Tarasova comparison of the two annual increases.
- As of
- 2026-10-28
- Limit
- Concentration additions, not emissions tonnes or a 2026 forecast.
Retrieved 2026-10-28T11:29:41.232Z · UN News, reporting WMO
Supports only the cited visible passages. Retrieval does not establish accuracy, independence, completeness or downstream effects.
3.Check which quantity a claim usesAttributed
The bulletin measures gas accumulated in the atmosphere, not new annual emissions. Land and ocean absorption also matters. These figures cannot alone evaluate one country’s policy or attribute a local disaster.
- Scope
- UN News October 27 account of WMO’s 2025 global annual atmospheric measurements. Concentration in parts per million differs from annual emissions. No local weather attribution, personal exposure guidance or observed 2026 total.
- Evidence passage
- “CO₂ growth rates triple”, first paragraph.
- As of
- 2026-10-28
- Limit
- No specific policy evaluation, local storm attribution or causal claim.
Retrieved 2026-10-28T11:29:41.232Z · UN News, reporting WMO
Supports only the cited visible passages. Retrieval does not establish accuracy, independence, completeness or downstream effects.
4.Use the distinction in the next headlineAttributed
Check the quantity, period and geography before reading a climate claim as progress or failure. The linked account explains the measurements and WMO’s call for continued atmospheric monitoring as energy systems change.
- Scope
- UN News October 27 account of WMO’s 2025 global annual atmospheric measurements. Concentration in parts per million differs from annual emissions. No local weather attribution, personal exposure guidance or observed 2026 total.
- Evidence passage
- “Energy transformation concerns”, final WMO monitoring statement.
- As of
- 2026-10-28
- Limit
- Monitoring need, not proof any particular energy project has negated its benefits.
Retrieved 2026-10-28T11:29:41.232Z · UN News, reporting WMO
Supports only the cited visible passages. Retrieval does not establish accuracy, independence, completeness or downstream effects.
What remains open.
- 2025 global mean; not a station reading, health threshold or independently reproduced dataset.
- Concentration additions, not emissions tonnes or a 2026 forecast.
- No specific policy evaluation, local storm attribution or causal claim.
- Monitoring need, not proof any particular energy project has negated its benefits.
A corrected original record, verified changed status, missing underlying documentation or measured outcome at this scope requires a separately preserved version and fresh exact-source review.
THIS STORY IN TIME
Keep the dates with the story.
- Reported development
- Evidence as of
- First retained publication
- This version published
Publication times are Central. A development date and an evidence date can differ. Missing dates remain unrecorded.