← 2026-10-16 edition · Sourced reporting
Published Oct 16, 2026, 10:00 AM Central · This version Oct 16, 2026, 10:00 AM Central · As of 2026-10-16
Three power grids set summer demand records. That does not measure your bill.
EIA’s October 15 analysis identifies record summer peaks for PJM, ERCOT and Southwest Power Pool. The figures measure regional power demand in particular hours. They do not establish a shortage, a reliability failure or how much any household will pay. [1] [3]
Use EIA’s dated analysis and linked Hourly Electric Grid Monitor to inspect each grid, peak date and data-quality notes. These records do not replace your utility’s tariff or current outage information. →EIA’s October 15 analysis of balancing-authority Form EIA-930 data. Compare regional peak hourly load in gigawatts during summer 2026, not annual energy use, household bills, shortages or simultaneous national demand.
- 1 source record
- US Energy Information Administration
Still open: No independent reconstruction of Form EIA-930 records or attribution of each peak to weather versus structural growth was obtained. All open questions ↓
Reporting question · As of 2026-10-16
The question: What does EIA’s new summer peak-demand analysis establish for electricity users?
EIA’s October 15 analysis of balancing-authority Form EIA-930 data. Compare regional peak hourly load in gigawatts during summer 2026, not annual energy use, household bills, shortages or simultaneous national demand.
Summer 2026 peak hourly load; published October 15 · gigawatts (GW)
Different regional systems and dates; these are not simultaneous loads, household costs or season-long energy totals. Form EIA-930 values may differ from operator publications.
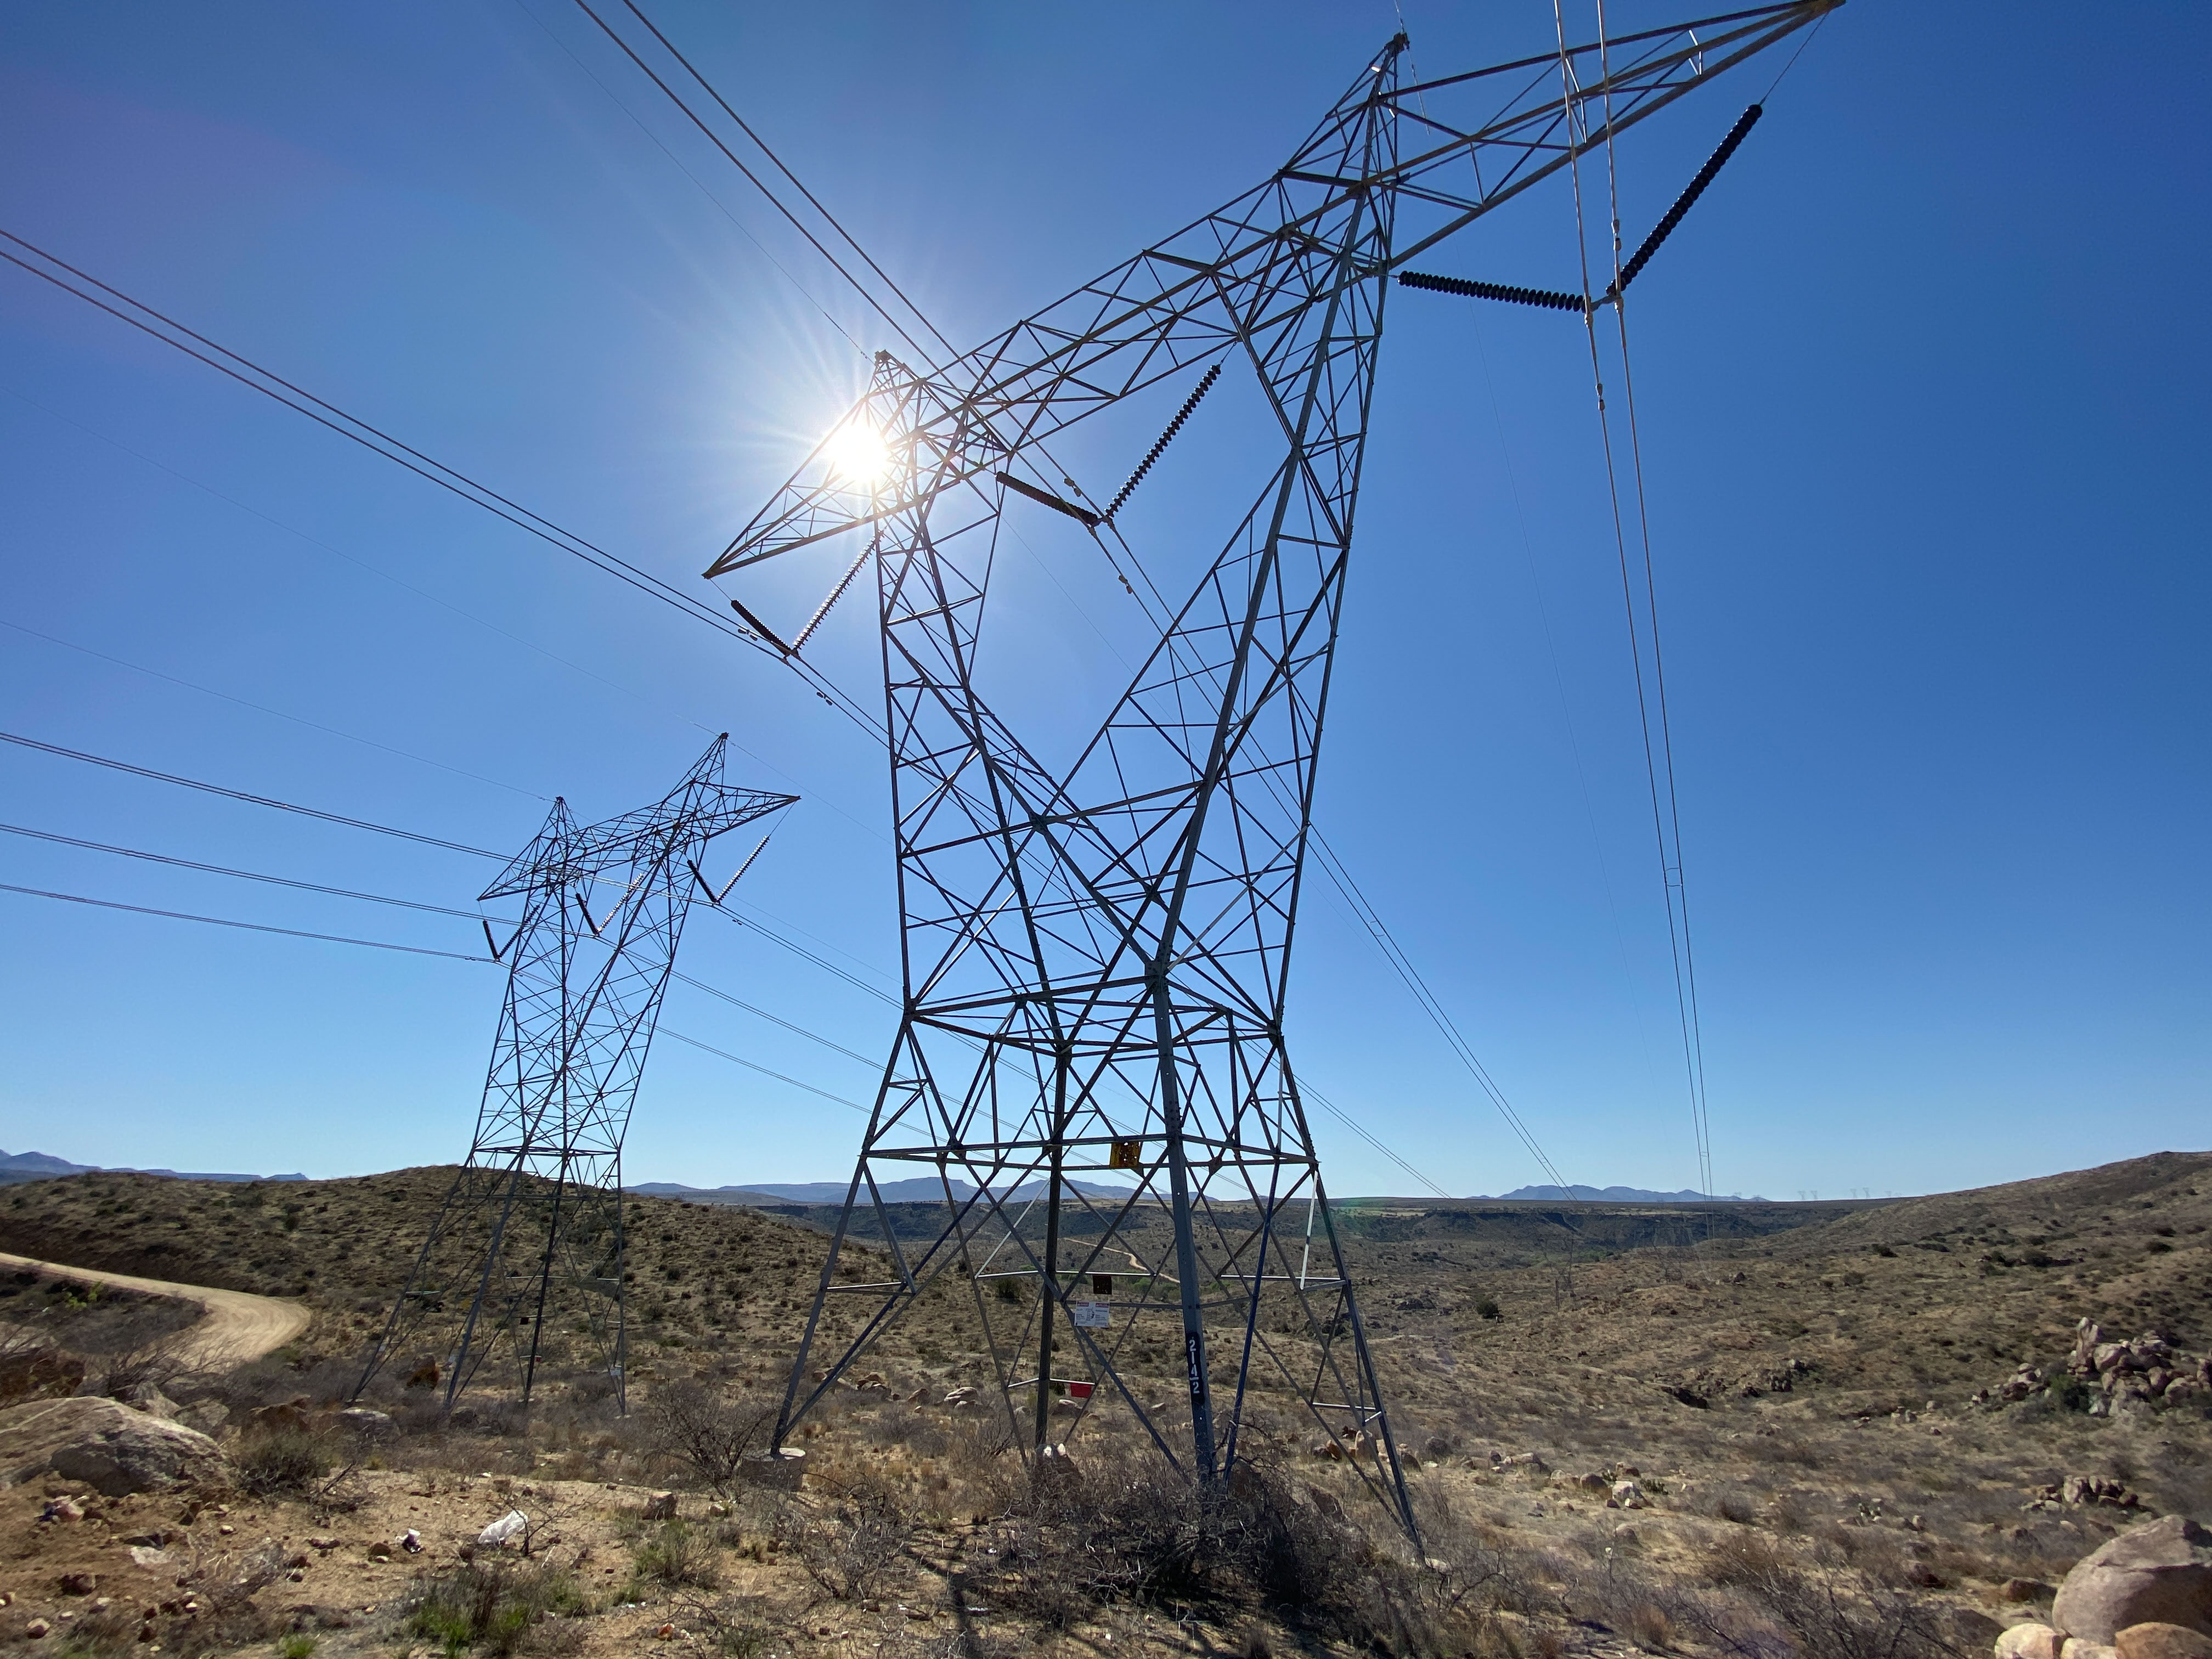
Archive photograph · 2025-04-10 · Arizona, United States


Understand the story.
A new account of July peaks
PJM reached 162.6 GW, ERCOT 91.1 GW and Southwest Power Pool 58.0 GW on different July dates. EIA identifies each as a record against its earlier reported peak. The October 15 publication is new; these are summer observations. [1]
What the numbers can explain
EIA links most peaks to heat waves and cooling demand. That attribution does not separate heat from growth in underlying electricity demand. Do not add these different-time peaks into a simultaneous national total or read them as a household price forecast. [1] [2]
Keep the dataset label
EIA flags reporting limits and differences from operators’ own records. Its discussion of New York and the Midwest shows why a monitor’s highest value and an operator’s older record can differ. Inspect the source’s data notes before repeating an all-time-record claim. [3]
How we know3 scoped claims · 1 source recordView evidence
Each claim keeps its full assertion, date, source passage and limits. Source counts describe records, not independent corroboration.
1.The three peaksSupported
EIA’s October 15 analysis identifies 2026 summer peak hourly loads of 162.6 GW in PJM on July 2, 91.1 GW in ERCOT on July 22, and 58.0 GW in Southwest Power Pool on July 27, each above its pre-2026 record in the cited data.
- Scope
- EIA’s October 15 analysis of balancing-authority Form EIA-930 data. Compare regional peak hourly load in gigawatts during summer 2026, not annual energy use, household bills, shortages or simultaneous national demand.
- Evidence passage
- Opening three record bullets, immediately below the first chart.
- As of
- 2026-10-16
- Limit
- Different regions and dates. GW is power during a peak hour, not energy consumed over a season or a household bill.
Retrieved 2026-10-16T14:01:50.352Z · US Energy Information Administration
Agency analysis of balancing-authority reports supplied as-is. EIA warns of reporting issues and differences from authority publications; no independent reconstruction or household-price study was obtained.
2.Heat is the agency’s explanationAttributed
EIA says most of the peaks occurred during regional heat waves that increased cooling demand.
- Scope
- EIA’s October 15 analysis of balancing-authority Form EIA-930 data. Compare regional peak hourly load in gigawatts during summer 2026, not annual energy use, household bills, shortages or simultaneous national demand.
- Evidence passage
- Paragraph immediately after the three record bullets.
- As of
- 2026-10-16
- Limit
- Issuer’s explanation, not a decomposition of weather, underlying load growth and other causes.
Retrieved 2026-10-16T14:01:50.352Z · US Energy Information Administration
Agency analysis of balancing-authority reports supplied as-is. EIA warns of reporting issues and differences from authority publications; no independent reconstruction or household-price study was obtained.
3.A reporting boundary mattersSupported
EIA says Form EIA-930 values are provided as-is, reporting issues may limit quality, and balancing authorities’ own publications can differ. It also distinguishes peaks in its monitor from older records reported directly by NYISO and MISO.
- Scope
- EIA’s October 15 analysis of balancing-authority Form EIA-930 data. Compare regional peak hourly load in gigawatts during summer 2026, not annual energy use, household bills, shortages or simultaneous national demand.
- Evidence passage
- Second chart discussion, NYISO and MISO bullets, final data-quality paragraph.
- As of
- 2026-10-16
- Limit
- A record within a dataset does not automatically establish an all-time record under every operator’s series.
Retrieved 2026-10-16T14:01:50.352Z · US Energy Information Administration
Agency analysis of balancing-authority reports supplied as-is. EIA warns of reporting issues and differences from authority publications; no independent reconstruction or household-price study was obtained.
What remains open.
- No independent reconstruction of Form EIA-930 records or attribution of each peak to weather versus structural growth was obtained.
- The analysis does not establish a power shortage, blackout, adequacy margin or household price change.
- Current bills, tariffs and utility-specific service conditions must be checked separately.
A newer or corrected original that changes the central finding, scope, operational status or applicable dates requires a separately identified revision and renewed source review.
THIS STORY IN TIME
Keep the dates with the story.
- Reported development
- Evidence as of
- First retained publication
- This version published
Publication times are Central. A development date and an evidence date can differ. Missing dates remain unrecorded.