← 2026-10-20 edition · Sourced reporting
Published Oct 20, 2026, 2:22 PM Central · This version Oct 20, 2026, 2:22 PM Central · As of 2026-10-20
EIA: hybrids reach 16% of new U.S. sales as battery cars fall to 6%
EIA’s new third-quarter analysis puts hybrids at 16% of U.S. new light-duty sales and battery-only vehicles at 6%. These are different technologies and shares of new sales. Car shoppers still need to compare actual models, offers and fuel or charging assumptions. [1] [2] [3]
Compare the specific cars you are considering →United States new light-duty vehicle sales in third-quarter 2025 and third-quarter 2026, newly analyzed by EIA October 19, 2026 using Omdia estimates. Shares of new sales, not the registered fleet, individual costs, all-electrified vehicles treated as identical, or a causal estimate of tax policy.
- 1 source record
- U.S. Energy Information Administration
Still open: EIA credits Omdia estimates; underlying transaction data, estimation method, uncertainty intervals and exact sales counts are not attached. The reported shares are rounded. No household savings, causal tax-credit effect or model recommendation is established. All open questions ↓
Reporting question · As of 2026-10-20
The question: What does EIA’s new vehicle-sales analysis tell a U.S. car shopper, and what still needs a personal comparison?
United States new light-duty vehicle sales in third-quarter 2025 and third-quarter 2026, newly analyzed by EIA October 19, 2026 using Omdia estimates. Shares of new sales, not the registered fleet, individual costs, all-electrified vehicles treated as identical, or a causal estimate of tax policy.
Third quarter 2025 compared with third quarter 2026 · Percent of U.S. new light-duty vehicle sales
EIA analysis of Omdia estimates, published October 19. Same new-sales denominator in each quarter; rounded shares, not vehicle counts, registered-fleet shares, household savings or an isolated policy effect.
Read the values and scale as a table
| Measure | Value (Percent of U.S. new light-duty vehicle sales) | Evidence |
|---|---|---|
| Battery electric — Q3 2025 | 10 | [2] |
| Battery electric — Q3 2026 | 6 | [2] |
| Plug-in hybrid — Q3 2025 | 1.8 | [2] |
| Plug-in hybrid — Q3 2026 | 0.7 | [2] |
Archive photograph · 2015-10-18 · Nedlands, Western Australia, Australia
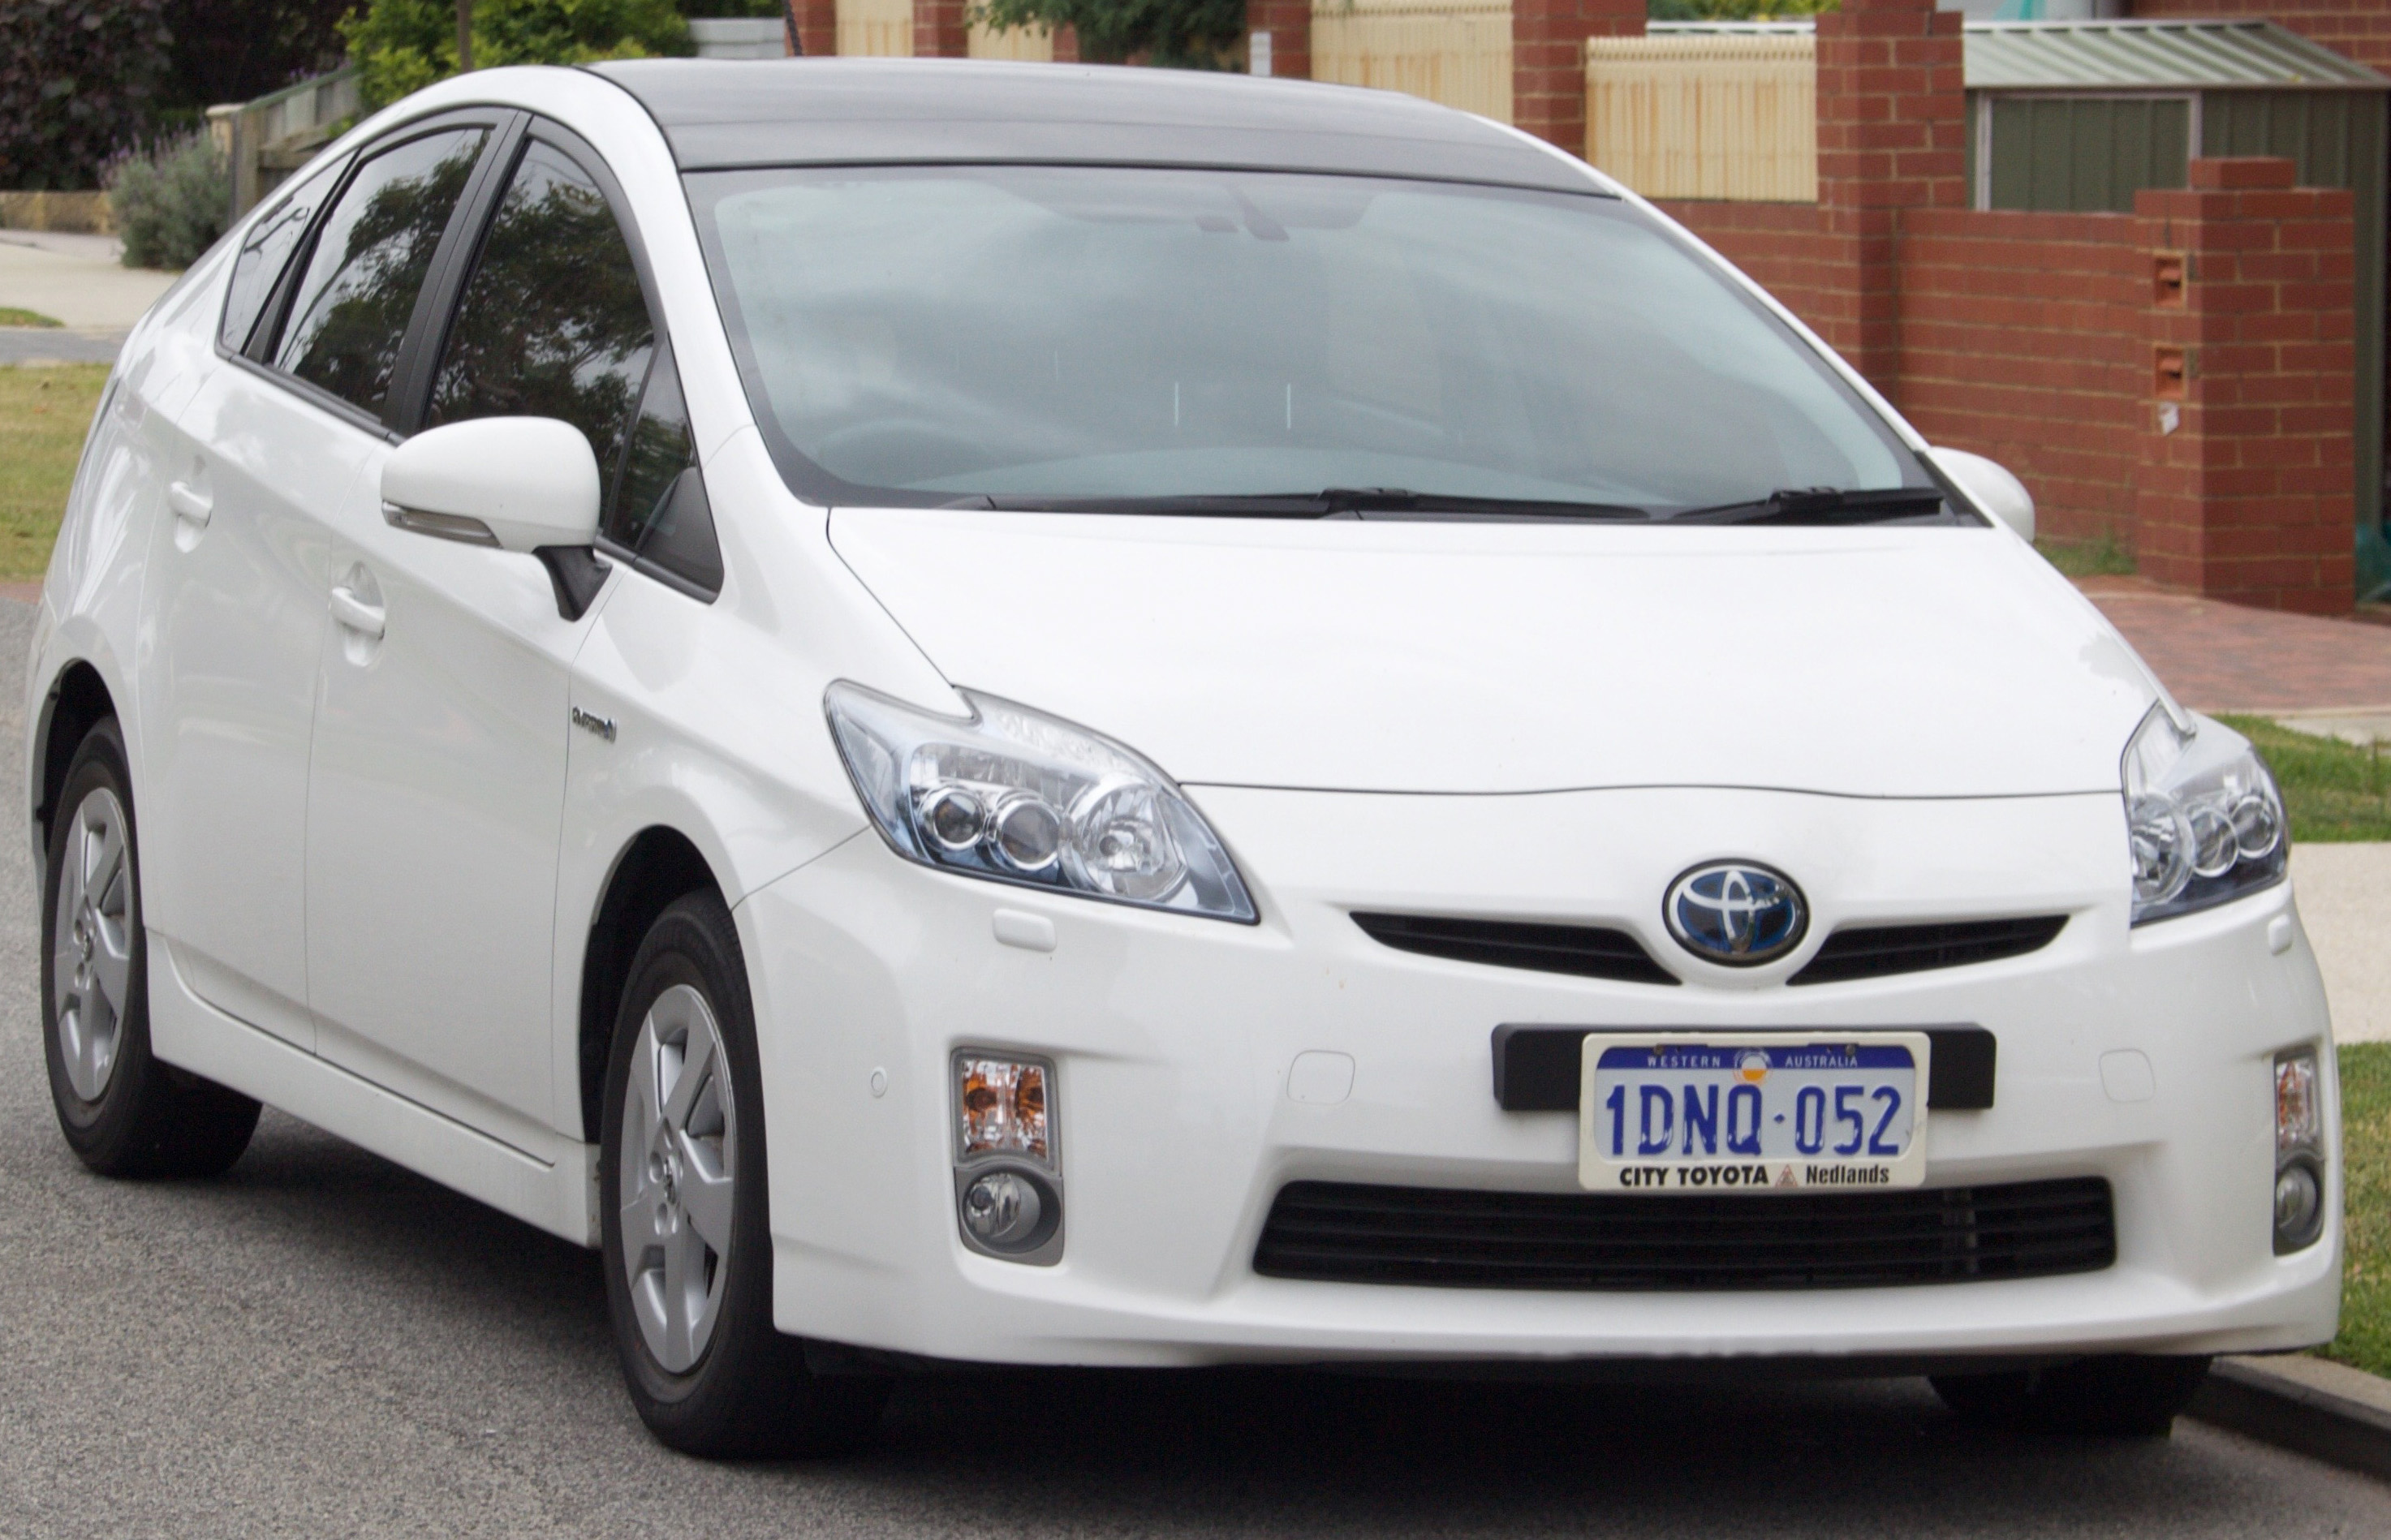

Understand the story.
The new finding is a split sales mix
EIA’s October 19 analysis reports hybrids at 16% of new U.S. light-duty sales in the third quarter. Battery-only cars were at 6%, compared with 10% a year earlier; plug-in hybrids fell from 1.8% to 0.7%. The combined share of the three types eased from 24% to 23%. Those rounded shares describe new sales, not every car on the road. [1] [2]
Check whether the car actually plugs in
EIA distinguishes hybrids using liquid fuel without a grid connection from battery-electric and plug-in hybrid vehicles using grid electricity. For a shopper, that makes the vehicle type a useful first question before comparing options. A rising category share does not tell you which specific car suits your driving or access to charging. [3]
The policy timing is not a causal calculation
EIA places the decline after two federal clean-vehicle credits expired in September 2025. The report does not isolate the credits’ effect from other market changes. It uses Omdia estimates; we have not obtained the underlying transactions, detailed method or uncertainty intervals. Its figures do not establish your purchase price or fuel savings. [4] [2]
Compare the cars you could actually buy
Use FuelEconomy.gov’s side-by-side comparison to select the year, make and model you are considering. Then compare the actual offers and the fuel or charging assumptions relevant to your use. The tool needs JavaScript for some features. The sales trend alone cannot decide whether changing vehicles would save you money. [3] [2]
How we know4 scoped claims · 1 source recordView evidence
Each claim keeps its full assertion, date, source passage and limits. Source counts describe records, not independent corroboration.
1.Different types move in different directionsAttributed
EIA’s October 19 analysis says hybrids reached 16% of U.S. new light-duty sales in the third quarter of 2026. The combined hybrid, battery-electric and plug-in-hybrid share was 23%, versus 24% in the same quarter of 2025.
- Scope
- United States new light-duty vehicle sales in third-quarter 2025 and third-quarter 2026, newly analyzed by EIA October 19, 2026 using Omdia estimates. Shares of new sales, not the registered fleet, individual costs, all-electrified vehicles treated as identical, or a causal estimate of tax policy.
- Evidence passage
- Article opening paragraph after the first chart; quarterly U.S. light-duty vehicle sales by powertrain. The denominator is new light-duty vehicle sales, not the vehicle fleet.
- As of
- 2026-10-20
- Limit
- EIA credits Omdia estimates; underlying transaction data, estimation method, uncertainty intervals and exact sales counts are not attached. The reported shares are rounded. No household savings, causal tax-credit effect or model recommendation is established.
Retrieved 2026-10-20T17:03:05.623Z · U.S. Energy Information Administration
EIA credits Omdia estimates; underlying transaction data, estimation method, uncertainty intervals and exact sales counts are not attached. The reported shares are rounded. No household savings, causal tax-credit effect or model recommendation is established.
2.Plug-in shares fallAttributed
EIA, citing Omdia estimates, reports battery-electric sales shares of 10% in third-quarter 2025 and 6% in third-quarter 2026. Plug-in hybrid shares fell from 1.8% to 0.7% over the same periods.
- Scope
- United States new light-duty vehicle sales in third-quarter 2025 and third-quarter 2026, newly analyzed by EIA October 19, 2026 using Omdia estimates. Shares of new sales, not the registered fleet, individual costs, all-electrified vehicles treated as identical, or a causal estimate of tax policy.
- Evidence passage
- Article second paragraph: market shares of battery electric and plug-in hybrid electric vehicles. Exact source values: battery electric 10% to 6%; plug-in hybrid 1.8% to 0.7%.
- As of
- 2026-10-20
- Limit
- EIA credits Omdia estimates; underlying transaction data, estimation method, uncertainty intervals and exact sales counts are not attached. The reported shares are rounded. No household savings, causal tax-credit effect or model recommendation is established.
Retrieved 2026-10-20T17:03:05.623Z · U.S. Energy Information Administration
EIA credits Omdia estimates; underlying transaction data, estimation method, uncertainty intervals and exact sales counts are not attached. The reported shares are rounded. No household savings, causal tax-credit effect or model recommendation is established.
3.A hybrid is not necessarily a plug-inSupported
EIA distinguishes hybrids that use liquid fuels and do not connect to the grid from battery-electric and plug-in hybrid vehicles that draw electricity from the grid.
- Scope
- United States new light-duty vehicle sales in third-quarter 2025 and third-quarter 2026, newly analyzed by EIA October 19, 2026 using Omdia estimates. Shares of new sales, not the registered fleet, individual costs, all-electrified vehicles treated as identical, or a causal estimate of tax policy.
- Evidence passage
- Article paragraph beginning “These vehicle types affect the broader energy sector”; technology-type illustration and description.
- As of
- 2026-10-20
- Limit
- EIA credits Omdia estimates; underlying transaction data, estimation method, uncertainty intervals and exact sales counts are not attached. The reported shares are rounded. No household savings, causal tax-credit effect or model recommendation is established.
Retrieved 2026-10-20T17:03:05.623Z · U.S. Energy Information Administration
EIA credits Omdia estimates; underlying transaction data, estimation method, uncertainty intervals and exact sales counts are not attached. The reported shares are rounded. No household savings, causal tax-credit effect or model recommendation is established.
4.Timing does not isolate a causeSupported
EIA places the estimates after the September 30, 2025 expiration of two federal clean-vehicle credits. This comparison supplies no estimate separating that policy effect from other changes in the vehicle market.
- Scope
- United States new light-duty vehicle sales in third-quarter 2025 and third-quarter 2026, newly analyzed by EIA October 19, 2026 using Omdia estimates. Shares of new sales, not the registered fleet, individual costs, all-electrified vehicles treated as identical, or a causal estimate of tax policy.
- Evidence passage
- Article paragraph beginning “Two tax credits for purchasing or leasing new electric vehicles expired”; limit: the article provides descriptive comparisons, not a controlled causal design.
- As of
- 2026-10-20
- Limit
- EIA credits Omdia estimates; underlying transaction data, estimation method, uncertainty intervals and exact sales counts are not attached. The reported shares are rounded. No household savings, causal tax-credit effect or model recommendation is established.
Retrieved 2026-10-20T17:03:05.623Z · U.S. Energy Information Administration
EIA credits Omdia estimates; underlying transaction data, estimation method, uncertainty intervals and exact sales counts are not attached. The reported shares are rounded. No household savings, causal tax-credit effect or model recommendation is established.
What remains open.
- EIA credits Omdia estimates; underlying transaction data, estimation method, uncertainty intervals and exact sales counts are not attached. The reported shares are rounded. No household savings, causal tax-credit effect or model recommendation is established.
- No independent current dealer-price comparison, charging-access assessment or individual cost calculation is established. FuelEconomy.gov help was fetched as a separate destination check; it is not a source for the sales estimates.
A corrected EIA/Omdia estimate, fuller methods or transaction-level evidence that changes the reported shares or their interpretation.
THIS STORY IN TIME
Keep the dates with the story.
- Reported development
- Evidence as of
- First retained publication
- This version published
Publication times are Central. A development date and an evidence date can differ. Missing dates remain unrecorded.