← 2026-10-23 edition · Sourced reporting
Published Oct 23, 2026, 5:12 PM Central · This version Oct 23, 2026, 5:12 PM Central · As of 2026-10-23
New Guinea’s fires produce exceptional carbon emissions; that is not a local smoke reading
NASA’s new account documents extensive New Guinea fires and reports exceptional modeled carbon emissions on both sides of the island. The evidence shows a major regional fire episode, with implications for air quality and daily life. It does not supply a current street-level smoke reading or a personal exposure estimate. [1] [2] [3] [4]
Explore dates and satellite fire detections in NASA FIRMS. Use local authorities for warnings; this map is not an air-quality or evacuation service. →New Guinea island: Papua New Guinea and Indonesian Papua. NASA October 22 analysis, October 11 NOAA-20 image and GFED estimates through October 17 for Papua New Guinea. Carbon emissions are modeled mass, not CO2, ambient smoke concentration, individual exposure or a local safety instruction.
- 1 source record
- NASA Earth Observatory
Still open: GFED model inputs, uncertainty and satellite observations were not independently replicated. All open questions ↓
Reporting question · As of 2026-10-23
The question: What does NASA’s new account establish about New Guinea fires and the limits of satellite evidence?
New Guinea island: Papua New Guinea and Indonesian Papua. NASA October 22 analysis, October 11 NOAA-20 image and GFED estimates through October 17 for Papua New Guinea. Carbon emissions are modeled mass, not CO2, ambient smoke concentration, individual exposure or a local safety instruction.
Modeled emissions
PNG: nearly 32 Mt carbon by Oct. 17. Indonesian Papua: over 35 Mt; cut-off not separately specified.
[2]New Guinea island: Papua New Guinea and Indonesian Papua. NASA October 22 analysis, October 11 NOAA-20 image and GFED estimates through October 17 for Papua New Guinea. Carbon emissions are modeled mass, not CO2, ambient smoke concentration, individual exposure or a local safety instruction. Cards group evidence and checks; they are not a measured sequence or shared numerical scale.
Read the process as a table
| Component | Meaning | Evidence |
|---|---|---|
| Dated image | NOAA-20 VIIRS: October 11. Smoke observation, not live conditions. | [1] |
| Modeled emissions | PNG: nearly 32 Mt carbon by Oct. 17. Indonesian Papua: over 35 Mt; cut-off not separately specified. | [2] |
| Different next checks | FIRMS for satellite detections; local authorities for safety instructions. | [4] |
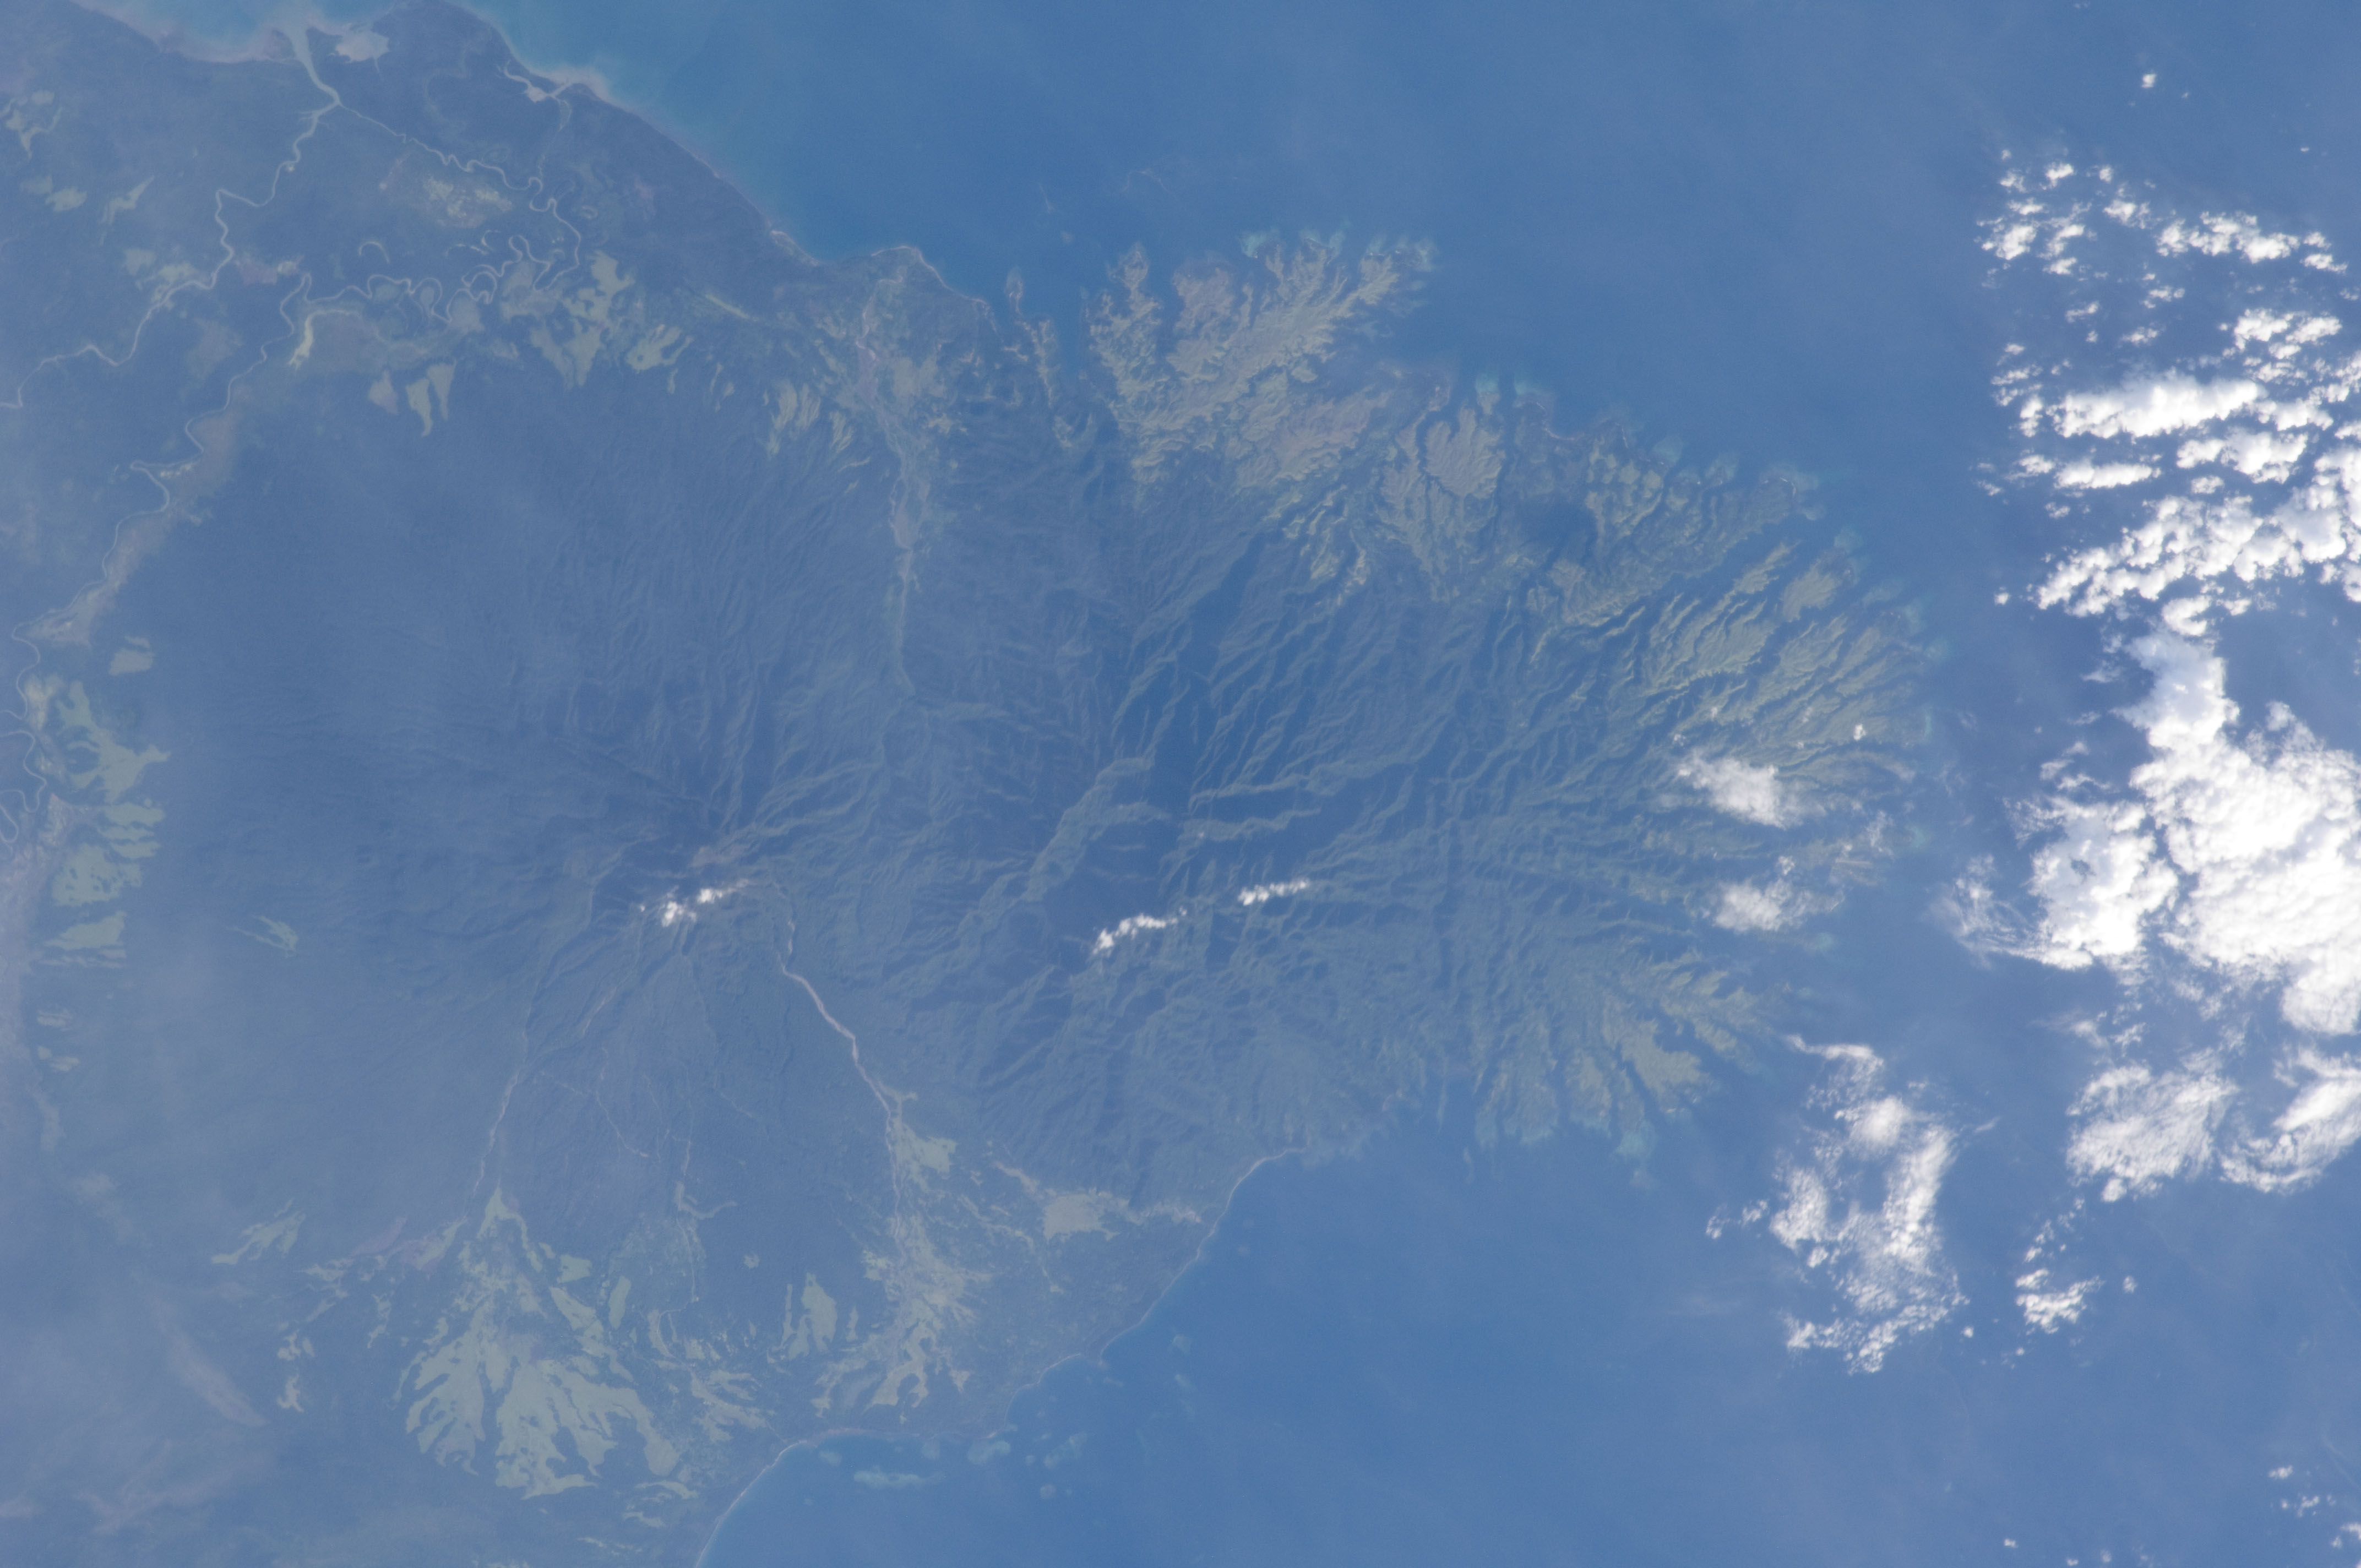
Archive photograph · 2012-12-03 · Papua New Guinea, viewed from the International Space Station


Understand the story.
What is new
NASA’s October 22 analysis connects an October 11 smoke image with GFED fire-emissions estimates and drought evidence. It describes disruption on the ground through attributed reporting; NTDS has no field observations. [1] [2] [3]
Keep the measurements apart
The reported carbon totals are modeled emissions, with different stated precision. They are not carbon dioxide totals or the concentration someone breathes. The image is dated, and neither it nor an emissions estimate can certify local safety. [2] [1]
Check the right kind of record
Use NASA’s FIRMS map to explore satellite fire detections and their dates. For personal safety, follow responsible local authorities and local conditions. A satellite detection alone is not an evacuation instruction or a safe travel route. [4]
How we know4 scoped claims · 1 source recordView evidence
Each claim keeps its full assertion, date, source passage and limits. Source counts describe records, not independent corroboration.
1.An observation has a dateSupported
NASA’s October 22 account uses a NOAA-20 VIIRS image taken October 11 showing smoke over southern New Guinea.
- Scope
- New Guinea island: Papua New Guinea and Indonesian Papua. NASA October 22 analysis, October 11 NOAA-20 image and GFED estimates through October 17 for Papua New Guinea. Carbon emissions are modeled mass, not CO2, ambient smoke concentration, individual exposure or a local safety instruction.
- Evidence passage
- Opening narrative and paragraph identifying the NOAA-20 image and observation date.
- As of
- 2026-10-23
- Limit
- The October 11 image is not a live October 23 observation. The separate archive photo is from 2012.
Retrieved 2026-10-23T20:01:28.385Z · NASA Earth Observatory
GFED model inputs, uncertainty and satellite observations were not independently replicated. No direct local reporting, personal exposure, current surface air-quality reading or October 23 evacuation/route status was obtained. WHO’s proposed smoke-advice page timed out. The verified FIRMS resource supplies satellite context only, with its safety limits visible.
2.Modeled carbon is not local air qualityAttributed
NASA reports GFED estimates of nearly 32 megatons of carbon in Papua New Guinea by October 17 and over 35 megatons in Indonesian Papua in its account. GFED uses satellite observations and other inputs.
- Scope
- New Guinea island: Papua New Guinea and Indonesian Papua. NASA October 22 analysis, October 11 NOAA-20 image and GFED estimates through October 17 for Papua New Guinea. Carbon emissions are modeled mass, not CO2, ambient smoke concentration, individual exposure or a local safety instruction.
- Evidence passage
- GFED paragraphs beginning “According to” and “On the Indonesian side”.
- As of
- 2026-10-23
- Limit
- Approximate/threshold values retain their qualifiers. No exact bar comparison, CO2 conversion or independent model replication. Indonesian estimate’s exact cut-off is not separately stated.
Retrieved 2026-10-23T20:01:28.385Z · NASA Earth Observatory
GFED model inputs, uncertainty and satellite observations were not independently replicated. No direct local reporting, personal exposure, current surface air-quality reading or October 23 evacuation/route status was obtained. WHO’s proposed smoke-advice page timed out. The verified FIRMS resource supplies satellite context only, with its safety limits visible.
3.Dry conditions and ignition interactAttributed
NASA describes El Niño-related drought priming vegetation to burn, with most ignitions linked to human activities; its account reports local disruption and expects fires to continue until heavier seasonal rains.
- Scope
- New Guinea island: Papua New Guinea and Indonesian Papua. NASA October 22 analysis, October 11 NOAA-20 image and GFED estimates through October 17 for Papua New Guinea. Carbon emissions are modeled mass, not CO2, ambient smoke concentration, individual exposure or a local safety instruction.
- Evidence passage
- Dry-weather, ignition and final wet-season paragraphs.
- As of
- 2026-10-23
- Limit
- Researcher explanation and attributed local reporting, not a quantified attribution to a specific person, fire or facility; future rain is not guaranteed.
Retrieved 2026-10-23T20:01:28.385Z · NASA Earth Observatory
GFED model inputs, uncertainty and satellite observations were not independently replicated. No direct local reporting, personal exposure, current surface air-quality reading or October 23 evacuation/route status was obtained. WHO’s proposed smoke-advice page timed out. The verified FIRMS resource supplies satellite context only, with its safety limits visible.
4.A satellite-data routeSupported
NASA’s article links its Fire Information for Resource Management System (FIRMS) among the references and resources.
- Scope
- New Guinea island: Papua New Guinea and Indonesian Papua. NASA October 22 analysis, October 11 NOAA-20 image and GFED estimates through October 17 for Papua New Guinea. Carbon emissions are modeled mass, not CO2, ambient smoke concentration, individual exposure or a local safety instruction.
- Evidence passage
- References & Resources: NASA (2026), Fire Information for Resource Management System (FIRMS).
- As of
- 2026-10-23
- Limit
- A detection map is not a local warning, evacuation order, air-quality monitor or route clearance.
Retrieved 2026-10-23T20:01:28.385Z · NASA Earth Observatory
GFED model inputs, uncertainty and satellite observations were not independently replicated. No direct local reporting, personal exposure, current surface air-quality reading or October 23 evacuation/route status was obtained. WHO’s proposed smoke-advice page timed out. The verified FIRMS resource supplies satellite context only, with its safety limits visible.
What remains open.
- GFED model inputs, uncertainty and satellite observations were not independently replicated.
- No direct local reporting, personal exposure, current surface air-quality reading or October 23 evacuation/route status was obtained.
- WHO’s proposed smoke-advice page timed out. The verified FIRMS resource supplies satellite context only, with its safety limits visible.
A revised original, verified contrary evidence, changed roster, scope, effective date or documented implementation outcome would reopen this case. Fresh retrieval, new identity or different prose alone is not a material development.
THIS STORY IN TIME
Keep the dates with the story.
- Reported development
- Evidence as of
- First retained publication
- This version published
Publication times are Central. A development date and an evidence date can differ. Missing dates remain unrecorded.
What readers add.
Comments are reviewed before they appear. Max includes five comments and two custom story requests each day.
Loading reviewed comments…
Add a comment with Max →