← 2026-10-23 edition · Sourced reporting
Published Oct 23, 2026, 7:00 AM Central · This version Oct 23, 2026, 7:00 AM Central · As of 2026-10-23
Refineries ran above 95% this summer; a smaller fleet limits the payoff
EIA reports U.S. refineries used more than 95% of available capacity from May through September. Yet output reached only its highest level since 2019: the fleet’s capacity is 4% smaller. Neither figure tells a driver what a local station will charge. [1] [2] [3]
For home heating or cooling affordability, check USAGov’s energy-bill assistance routes and local eligibility. This is not gasoline assistance or a promised benefit. →United States refinery fleet. EIA’s October 22 account of May–September 2026 utilization, capacity since 2019 and the first three weeks of October. Utilization is a capacity share, not gallons produced or a household fuel bill.
- 2 source records
- US Energy Information Administration
- USAGov
Still open: No local pump price, heating-oil quote, refinery-specific result or household saving is established. All open questions ↓
Reporting question · As of 2026-10-23
The question: Why does very high U.S. refinery utilization not establish record fuel output or a cheaper fill-up?
United States refinery fleet. EIA’s October 22 account of May–September 2026 utilization, capacity since 2019 and the first three weeks of October. Utilization is a capacity share, not gallons produced or a household fuel bill.
United States refinery fleet. EIA’s October 22 account of May–September 2026 utilization, capacity since 2019 and the first three weeks of October. Utilization is a capacity share, not gallons produced or a household fuel bill. Cards group records, not a causal sequence or shared numerical scale.
Read the process as a table
| Component | Meaning | Evidence |
|---|---|---|
| Capacity share | More than 95% used, May–September 2026; not an exact output volume. | [1] |
| Fleet size | Capacity down 4% since 2019; a different denominator. | [2] |
| New period | First three October weeks: lower than summer, above the 2021–25 seasonal average. | [3] |
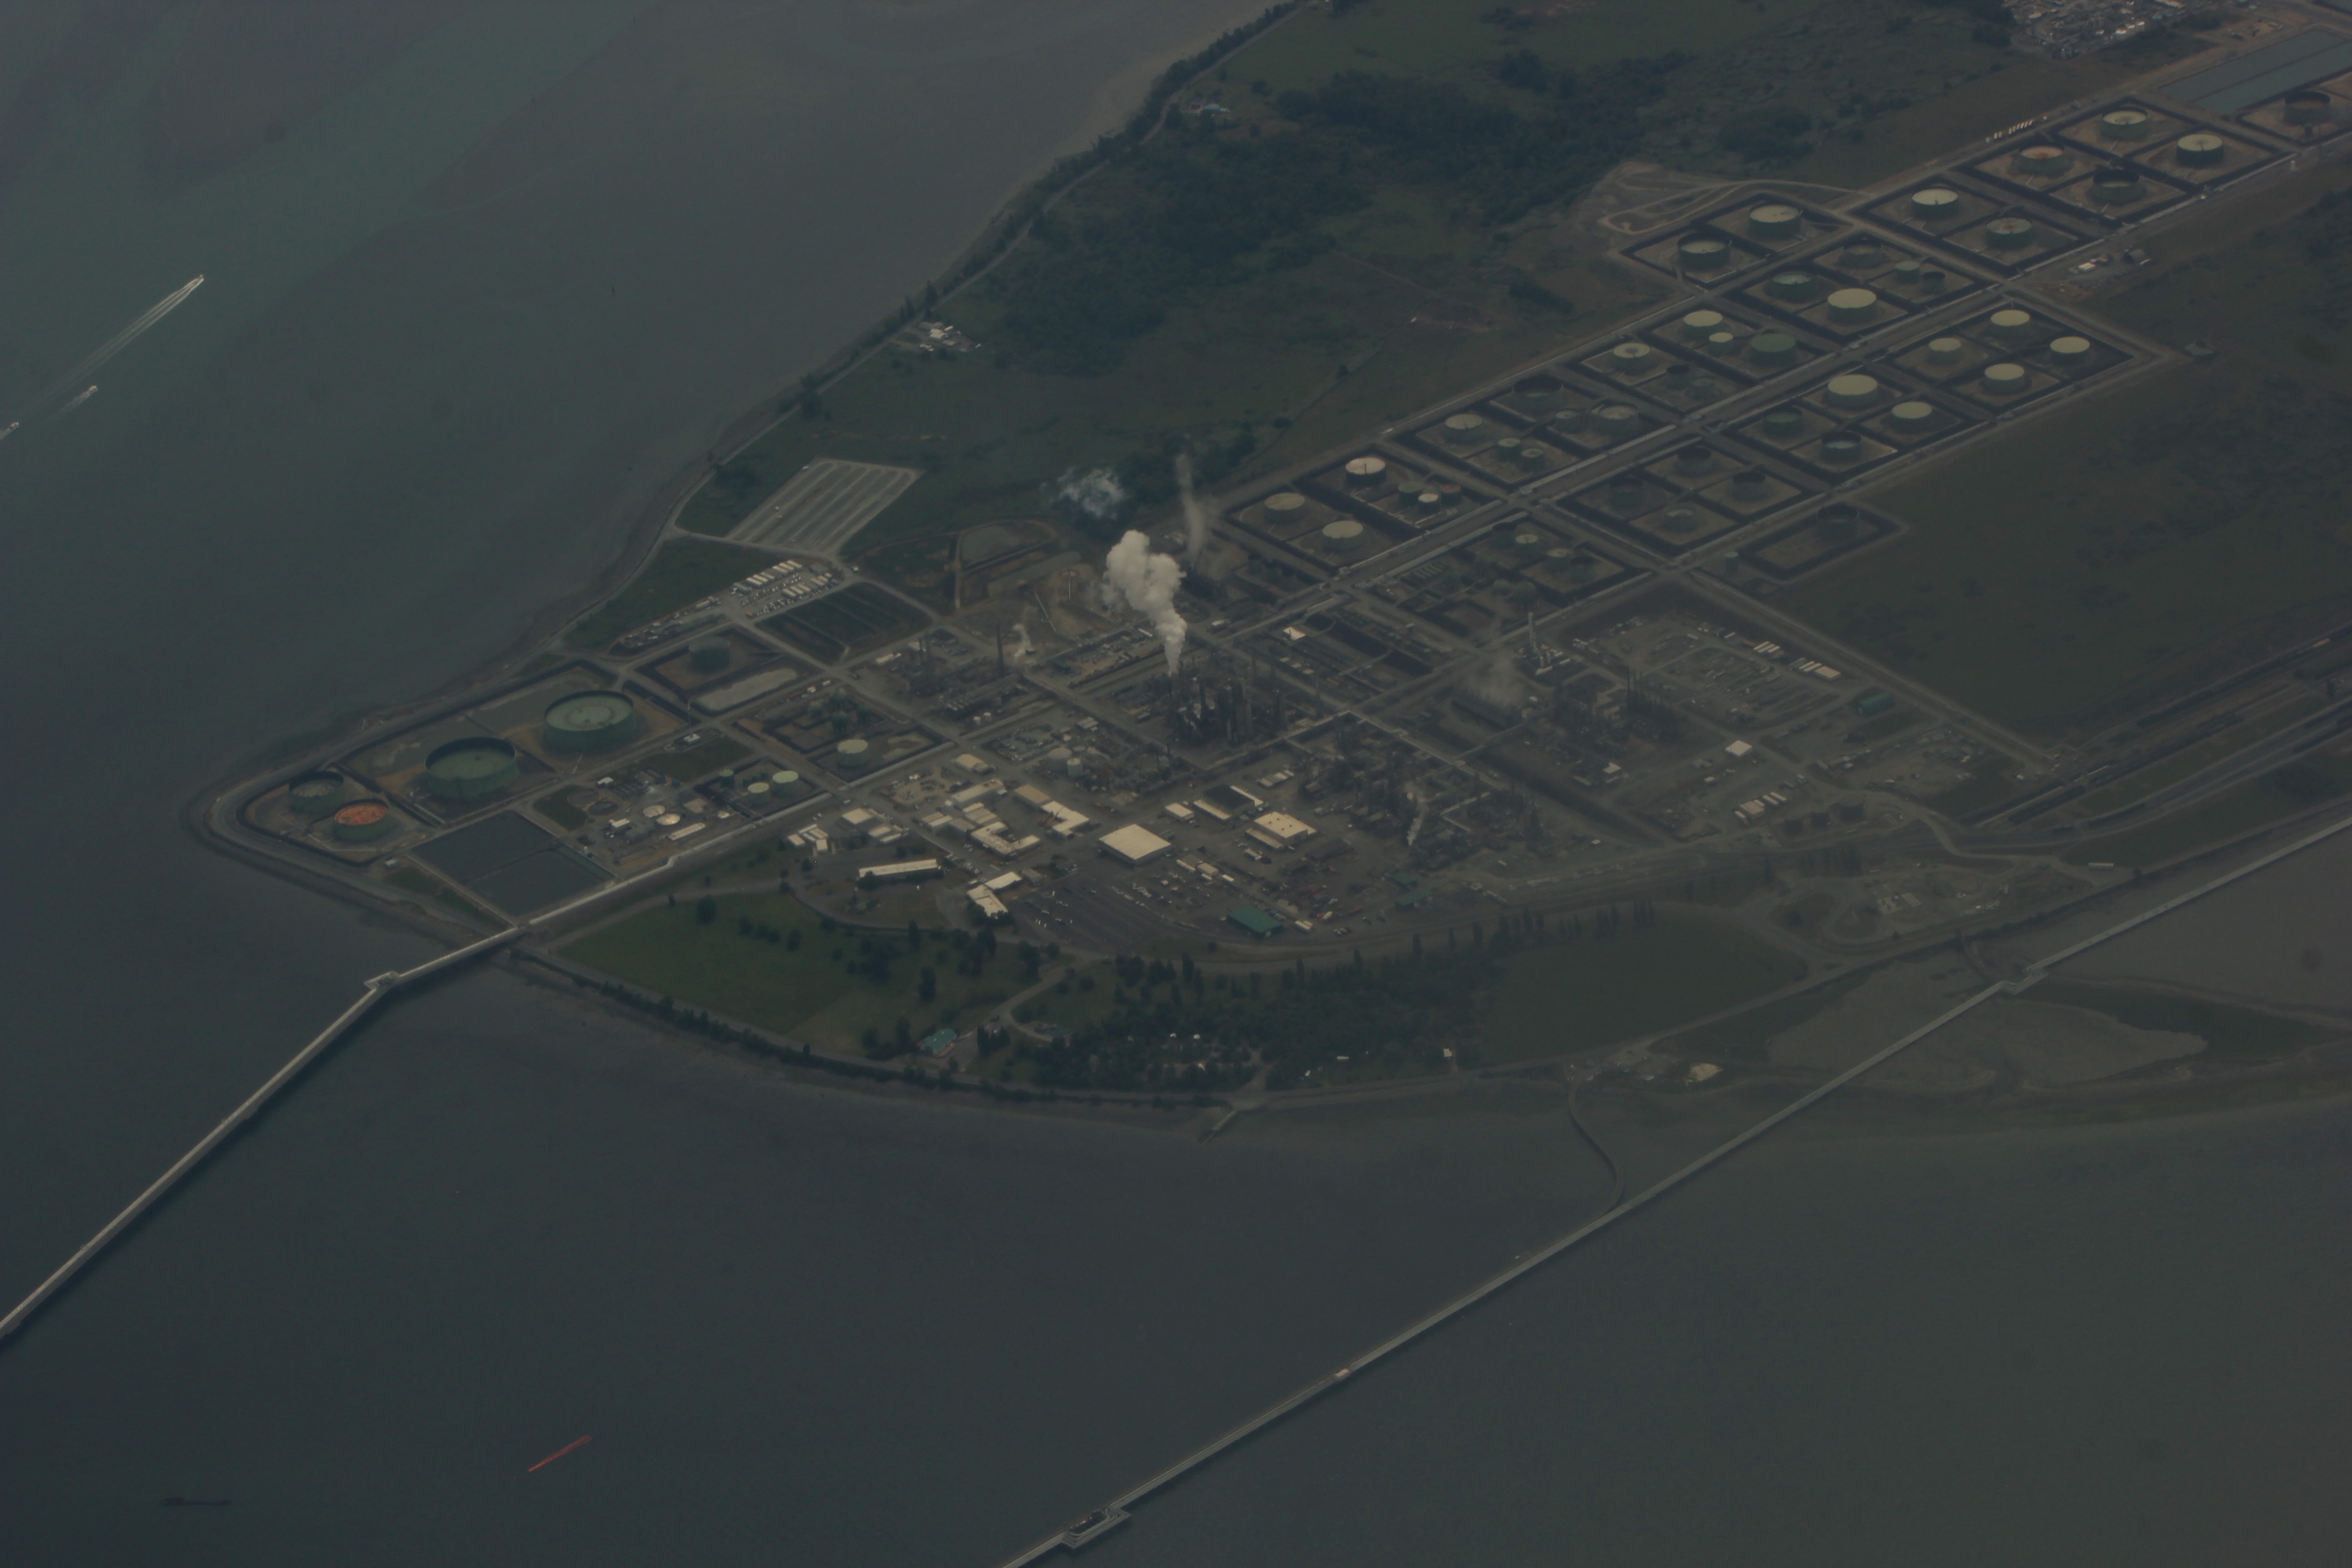
Archive photograph · 2015-05-30 · Anacortes, Washington, United States

Understand the story.
Busy plants, bounded measure
The October 22 analysis puts this summer’s utilization at its highest for those months since 1998. The denominator is available refining capacity. It is not a record number of gallons or a measure of an individual refinery. [1]
The denominator changed
A smaller fleet can run harder without producing a record volume. EIA identifies a 4% capacity decline since 2019, explaining why its output comparison reaches back only to that year. These percentages should not share a household-cost scale. [2]
October is a different period
EIA links strong runs to tight global distillate supply and export demand. Early-October utilization eased from summer highs while remaining above the five-year seasonal average. That is an attributed explanation, with no estimated saving at the pump. [3]
Use the right cost check
Compare actual local fuel offers rather than treating a refinery percentage as a price forecast. For a household struggling specifically with heating or cooling costs, USAGov’s energy-bill guide points to assistance and local checks; transport fuel and eligibility are separate questions. [4] [2]
How we know4 scoped claims · 2 source recordsView evidence
Each claim keeps its full assertion, date, source passage and limits. Source counts describe records, not independent corroboration.
1.High share of available capacitySupported
EIA says U.S. refinery utilization averaged more than 95% from May through September 2026, the highest for those months since 1998.
- Scope
- United States refinery fleet. EIA’s October 22 account of May–September 2026 utilization, capacity since 2019 and the first three weeks of October. Utilization is a capacity share, not gallons produced or a household fuel bill.
- Evidence passage
- Opening substantive paragraph, October 22 Today in Energy analysis.
- As of
- 2026-10-23
- Limit
- More than 95% is a lower-bound description, not an exact chart value or a measure of full-year output.
Retrieved 2026-10-23T10:02:12.987Z · US Energy Information Administration
Agency analysis of its petroleum statistics. Causal explanation is attributed to EIA; underlying series are not independently reconstructed here.
2.Less capacity than in 2019Supported
EIA says output was only the highest since 2019 because refining capacity has fallen 4% since then.
- Scope
- United States refinery fleet. EIA’s October 22 account of May–September 2026 utilization, capacity since 2019 and the first three weeks of October. Utilization is a capacity share, not gallons produced or a household fuel bill.
- Evidence passage
- Paragraph beginning “While refinery utilization was the highest since 1998”.
- As of
- 2026-10-23
- Limit
- Capacity change and utilization have different denominators; no plant-level cause or retail-price pass-through is quantified.
Retrieved 2026-10-23T10:02:12.987Z · US Energy Information Administration
Agency analysis of its petroleum statistics. Causal explanation is attributed to EIA; underlying series are not independently reconstructed here.
3.Distillate demand helps explain the runsAttributed
EIA attributes high runs largely to tight global distillate supplies and export demand. It says utilization fell from summer highs in October’s first three weeks but stayed above the 2021–25 seasonal average.
- Scope
- United States refinery fleet. EIA’s October 22 account of May–September 2026 utilization, capacity since 2019 and the first three weeks of October. Utilization is a capacity share, not gallons produced or a household fuel bill.
- Evidence passage
- Paragraphs on distillate supply and final paragraph on October.
- As of
- 2026-10-23
- Limit
- Agency explanation is not a controlled causal estimate; global supply and exports are not household bills.
Retrieved 2026-10-23T10:02:12.987Z · US Energy Information Administration
Agency analysis of its petroleum statistics. Causal explanation is attributed to EIA; underlying series are not independently reconstructed here.
4.Home energy assistance is a separate checkSupported
USAGov directs households to help with home heating and cooling bills and local eligibility checks.
- Scope
- United States refinery fleet. EIA’s October 22 account of May–September 2026 utilization, capacity since 2019 and the first three weeks of October. Utilization is a capacity share, not gallons produced or a household fuel bill.
- Evidence passage
- Help with energy bills: LIHEAP and assistance links.
- As of
- 2026-10-23
- Limit
- Home energy assistance, not a guarantee of transport-fuel aid, eligibility or funding.
Retrieved 2026-10-23T10:08:35.879Z · USAGov
Older service information, distinct from transport-fuel pricing; eligibility and availability are local.
What remains open.
- No local pump price, heating-oil quote, refinery-specific result or household saving is established.
- EIA’s underlying statistical series and causal attribution were not independently replicated; no precise October utilization is supplied.
A revised original, new contrary record, changed scope, final decision or documented outcome would reopen this exact case. New captures, timestamps or prose alone are not material news.
THIS STORY IN TIME
Keep the dates with the story.
- Reported development
- Evidence as of
- First retained publication
- This version published
Publication times are Central. A development date and an evidence date can differ. Missing dates remain unrecorded.