← 2026-10-29 edition · Sourced reporting
After-tax income rose in dollars but lost purchasing power in September
As of 2026-10-29 · Publication details
September 2026 versus August 2026; BEA October 29 release · % change from preceding month
Same U.S. disposable-income aggregate on two price bases; denominators are the preceding month’s corresponding measures. Not household wages or a personal inflation rate.
United States national personal income and outlays estimates for September 2026 versus August; BEA release October 29. Aggregate measures, not any individual household or paycheck.
BEA’s new September estimates put disposable personal income up 0.2% in dollars and down 0.3% after inflation. Spending rose 0.5% in dollars, while real spending rounded to 0.0%. These national aggregates explain a purchasing-power squeeze without measuring your own budget. [1] [2]
Still open: National aggregates do not show distribution across income groups, states or households. All open questions ↓
Check BEA’s dated income, spending and price tables →Read the full story
The reporting question: Did September’s rise in after-tax income buy more after inflation?
The rise in dollars is only half the answer
The October 29 BEA release puts September after-tax income, called disposable personal income, 0.2% above August in current dollars. Adjusted for inflation, the same national aggregate fell 0.3%. Those are different price bases for income, not changes in everyone’s salary. [1]
More spending did not mean much more volume
Spending increased 0.5% in dollars. Real spending rose by less than 0.1%, which rounds to 0.0% in BEA’s table. The PCE price index increased 0.5% over the month and 3.6% over a year. Keep those periods separate when comparing headlines. [2] [3]
Use the national signal with your own records
For a household check, compare your after-tax income and recurring costs over the same months; these aggregates cannot supply that answer. Use the dated BEA tables to check definitions and revisions. July and August have already been updated, and the next release is scheduled for November 25. [1] [4]
Archive photograph · 2006-10-03 · United States; city not established by the inspected description
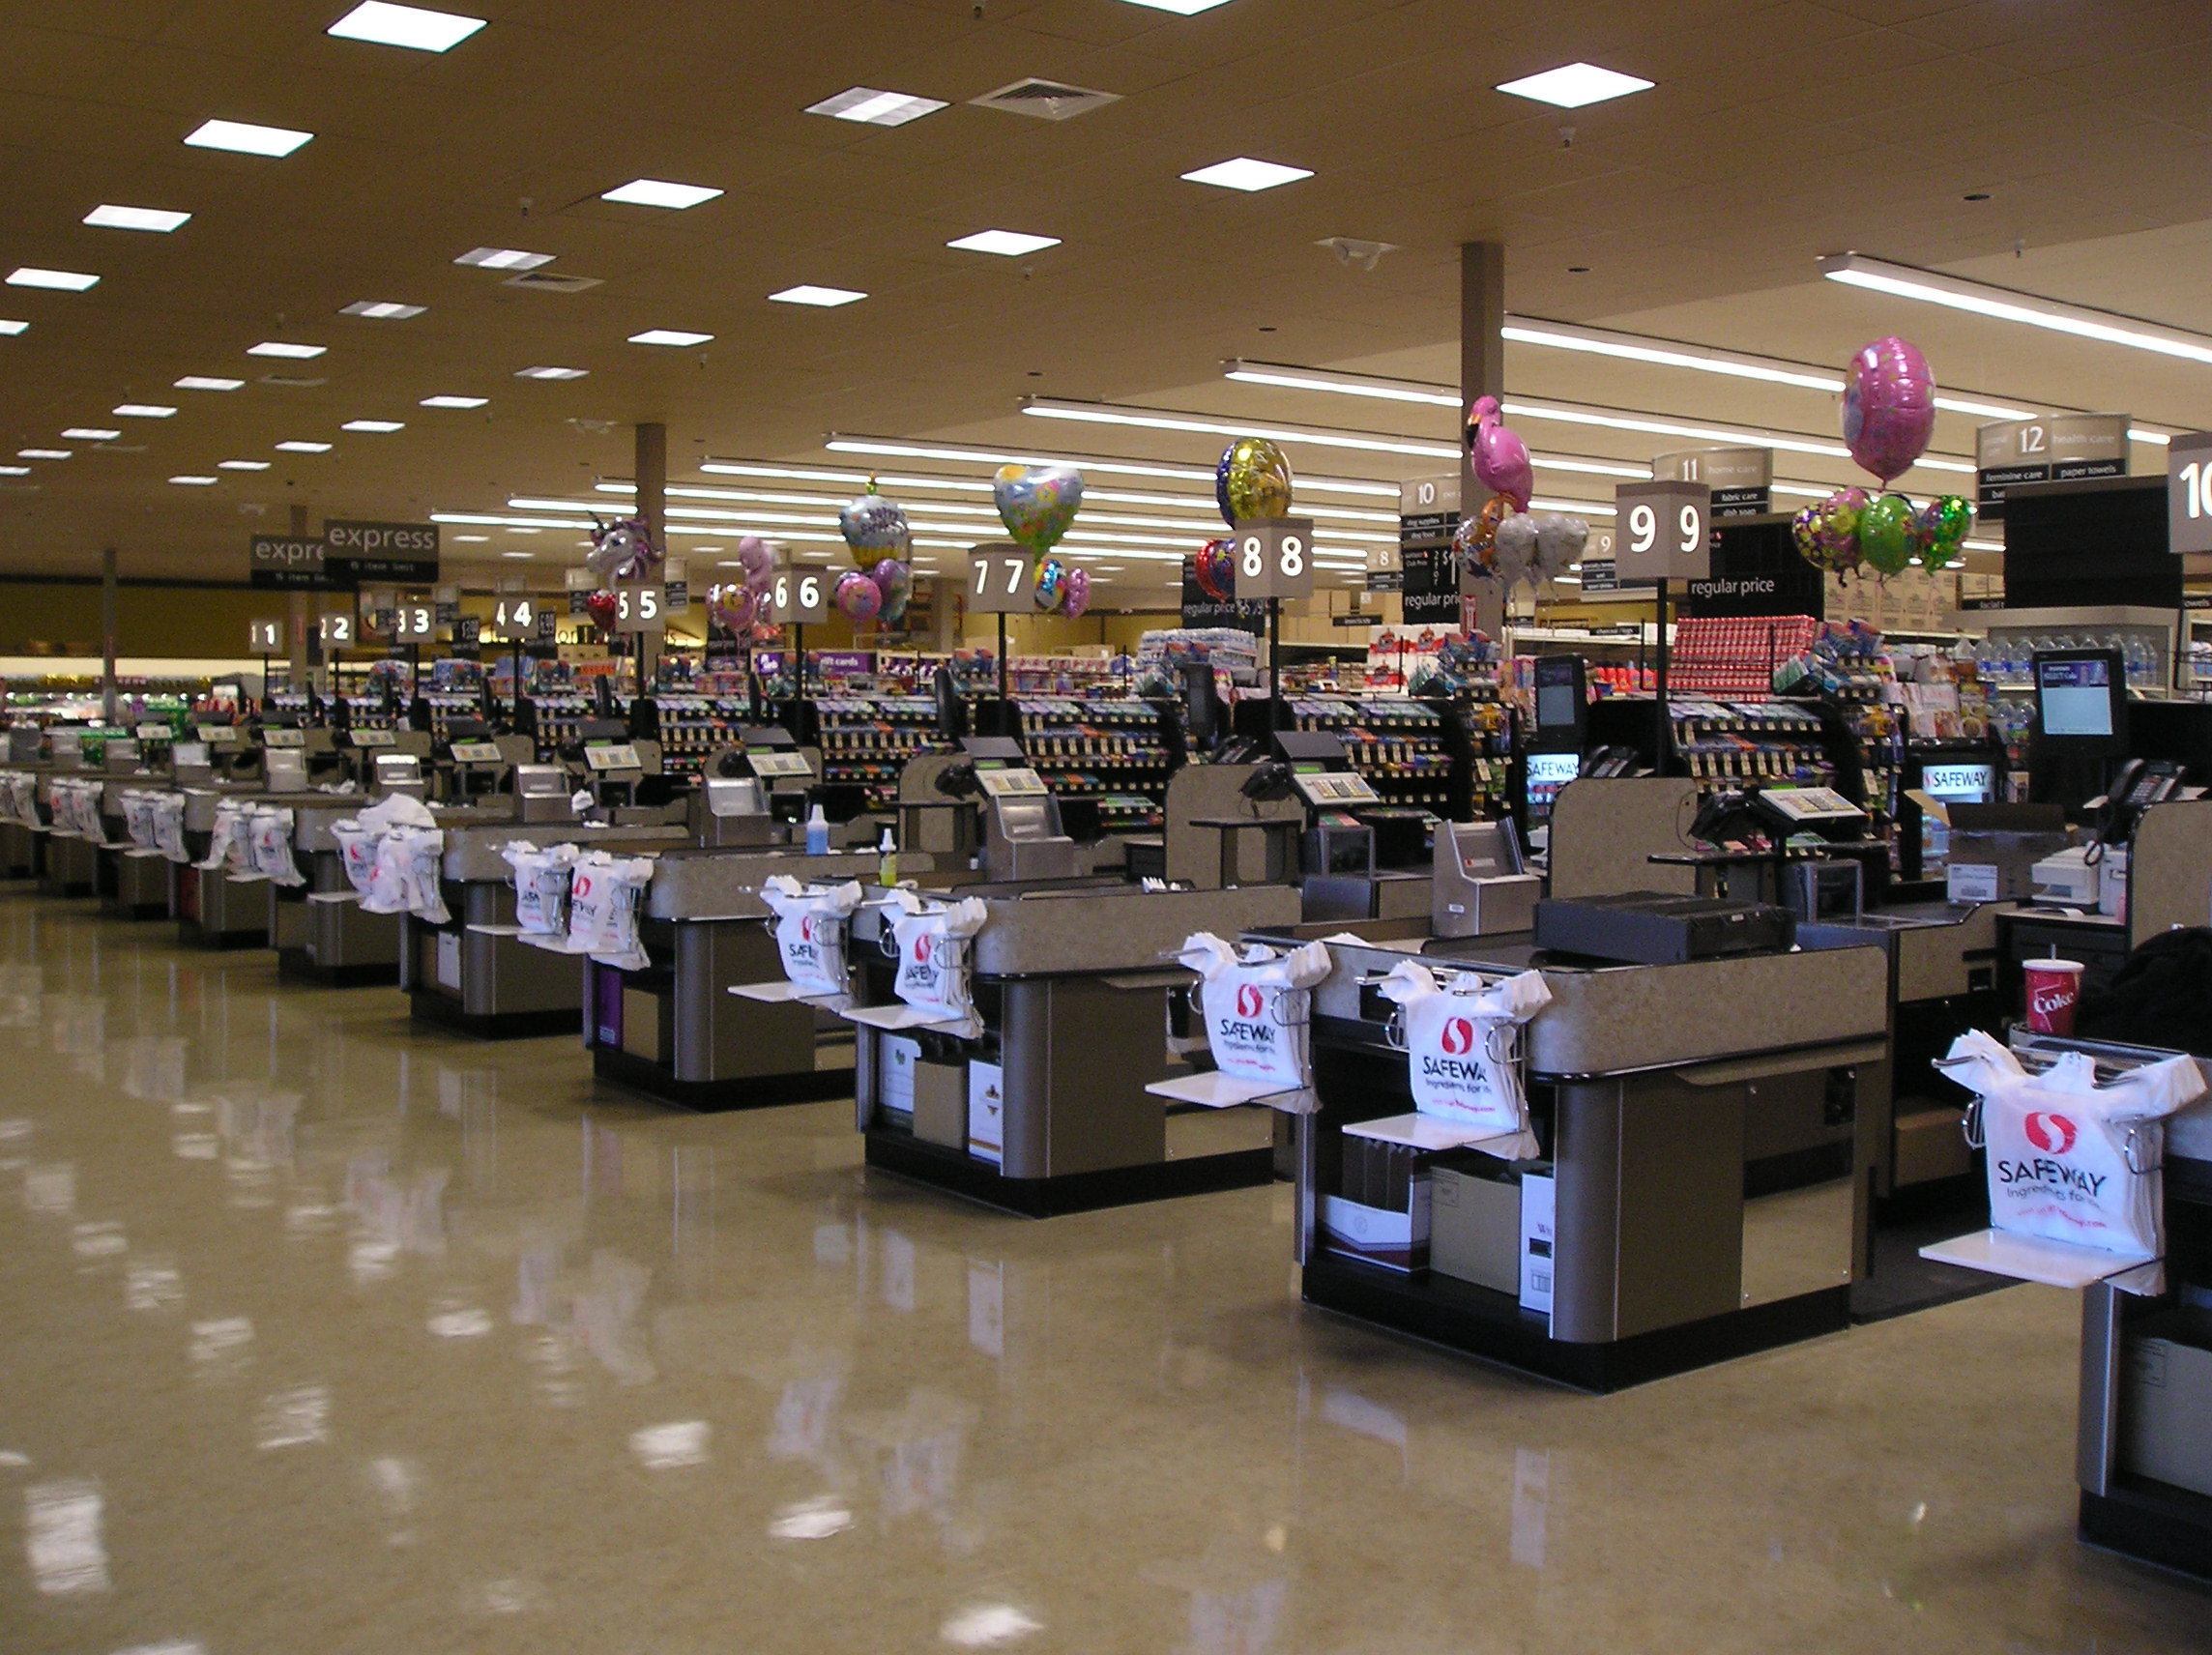

- 1 source record
- U.S. Bureau of Economic Analysis
How we know4 scoped claims · 1 source recordView evidence
Each claim keeps its full assertion, date, source passage and limits. Source counts describe records, not independent corroboration.
1.Income in dollars and buying powerSupported
September disposable personal income increased 0.2% in current dollars and fell 0.3% after inflation, according to BEA.
- Scope
- United States national personal income and outlays estimates for September 2026 versus August; BEA release October 29. Aggregate measures, not any individual household or paycheck.
- Evidence passage
- Opening paragraph; Personal Income and Related Measures table, September current-dollar DPI and real DPI rows.
- As of
- 2026-10-29
- Limit
- Percent changes from August in each corresponding national aggregate, not a wage change for every worker.
Retrieved 2026-10-29T21:11:33.639Z · U.S. Bureau of Economic Analysis
Official aggregate estimates subject to revision; no distributional or household-specific result established.
2.Dollar spending versus real spendingSupported
Current-dollar PCE rose 0.5% in September; BEA reports a real increase below 0.1%, rounded to 0.0% in its table.
- Scope
- United States national personal income and outlays estimates for September 2026 versus August; BEA release October 29. Aggregate measures, not any individual household or paycheck.
- Evidence passage
- Opening paragraph; Real PCE paragraph; Personal Income and Related Measures table.
- As of
- 2026-10-29
- Limit
- Rounded 0.0% does not mean exactly no underlying change; PCE is a national aggregate.
Retrieved 2026-10-29T21:11:33.639Z · U.S. Bureau of Economic Analysis
Official aggregate estimates subject to revision; no distributional or household-specific result established.
3.Two different price periodsSupported
The PCE price index rose 0.5% from August and 3.6% from September 2025.
- Scope
- United States national personal income and outlays estimates for September 2026 versus August; BEA release October 29. Aggregate measures, not any individual household or paycheck.
- Evidence passage
- Paragraphs beginning From the preceding month and From the same month one year ago.
- As of
- 2026-10-29
- Limit
- The monthly and year-over-year rates have different periods; neither is an individual shopping-basket bill.
Retrieved 2026-10-29T21:11:33.639Z · U.S. Bureau of Economic Analysis
Official aggregate estimates subject to revision; no distributional or household-specific result established.
4.Revisions and next releaseSupported
BEA updated July and August estimates and schedules the next monthly release for November 25, 2026.
- Scope
- United States national personal income and outlays estimates for September 2026 versus August; BEA release October 29. Aggregate measures, not any individual household or paycheck.
- Evidence passage
- Technical Notes: Revisions to personal income; Next release.
- As of
- 2026-10-29
- Limit
- A scheduled release is not an observed future outcome.
Retrieved 2026-10-29T21:11:33.639Z · U.S. Bureau of Economic Analysis
Official aggregate estimates subject to revision; no distributional or household-specific result established.
What remains open.
- National aggregates do not show distribution across income groups, states or households.
- BEA estimates and prior months can be revised; this is not a claim about October spending.
- The real-spending table is rounded: 0.0% is not an exact zero.
- Nominal income and prices jointly shape the real measure; this release does not isolate why every household’s circumstances changed.
Reopen this exact dated account if the original is corrected, a missing underlying record changes its scope, or a new observed outcome replaces a forecast, plan or initial estimate. Preserve this case and earlier public versions.
THIS STORY IN TIME
Keep the dates with the story.
- Reported development
- Evidence as of
- First retained publication
- This version published
Publication times are Central. A development date and an evidence date can differ. Missing dates remain unrecorded.