← 2026-10-17 edition · Sourced reporting
Published Oct 17, 2026, 1:21 PM Central · This version Oct 17, 2026, 1:21 PM Central · As of 2026-10-17
Rooftop solar’s growth is uneven—and its output is estimated
EIA’s October 16 analysis shows large differences in estimated 2025 rooftop and other small-scale solar output: California generated 34,411 GWh, compared with 5,795 in Arizona, 5,408 in Texas and 5,198 in Florida. These are aggregate energy estimates, not a household savings forecast. [1] [2] [3]
Read EIA’s methodology and linked modeling resources before applying a state total to a roof. The report explains how estimates are made; it does not quote a household tariff or payback. →United States small-scale photovoltaic systems under 1 megawatt; EIA analysis published October 16, 2026, with selected state generation estimates for 2025. Not a household savings, output guarantee or incentive-eligibility calculation.
- 1 source record
- U.S. Energy Information Administration
Still open: No household tariff, roof assessment, financing terms or individual output measured. Incentive eligibility is not verified here. All open questions ↓
Reporting question · As of 2026-10-17
The question: What does EIA’s new small-scale solar analysis tell households considering a system?
United States small-scale photovoltaic systems under 1 megawatt; EIA analysis published October 16, 2026, with selected state generation estimates for 2025. Not a household savings, output guarantee or incentive-eligibility calculation.
Calendar year 2025; analysis published October 16, 2026 · gigawatthours (GWh)
Selected U.S. states; photovoltaic systems smaller than 1 MW. Estimated generation, not capacity, output per roof, bill savings or all U.S. generation.
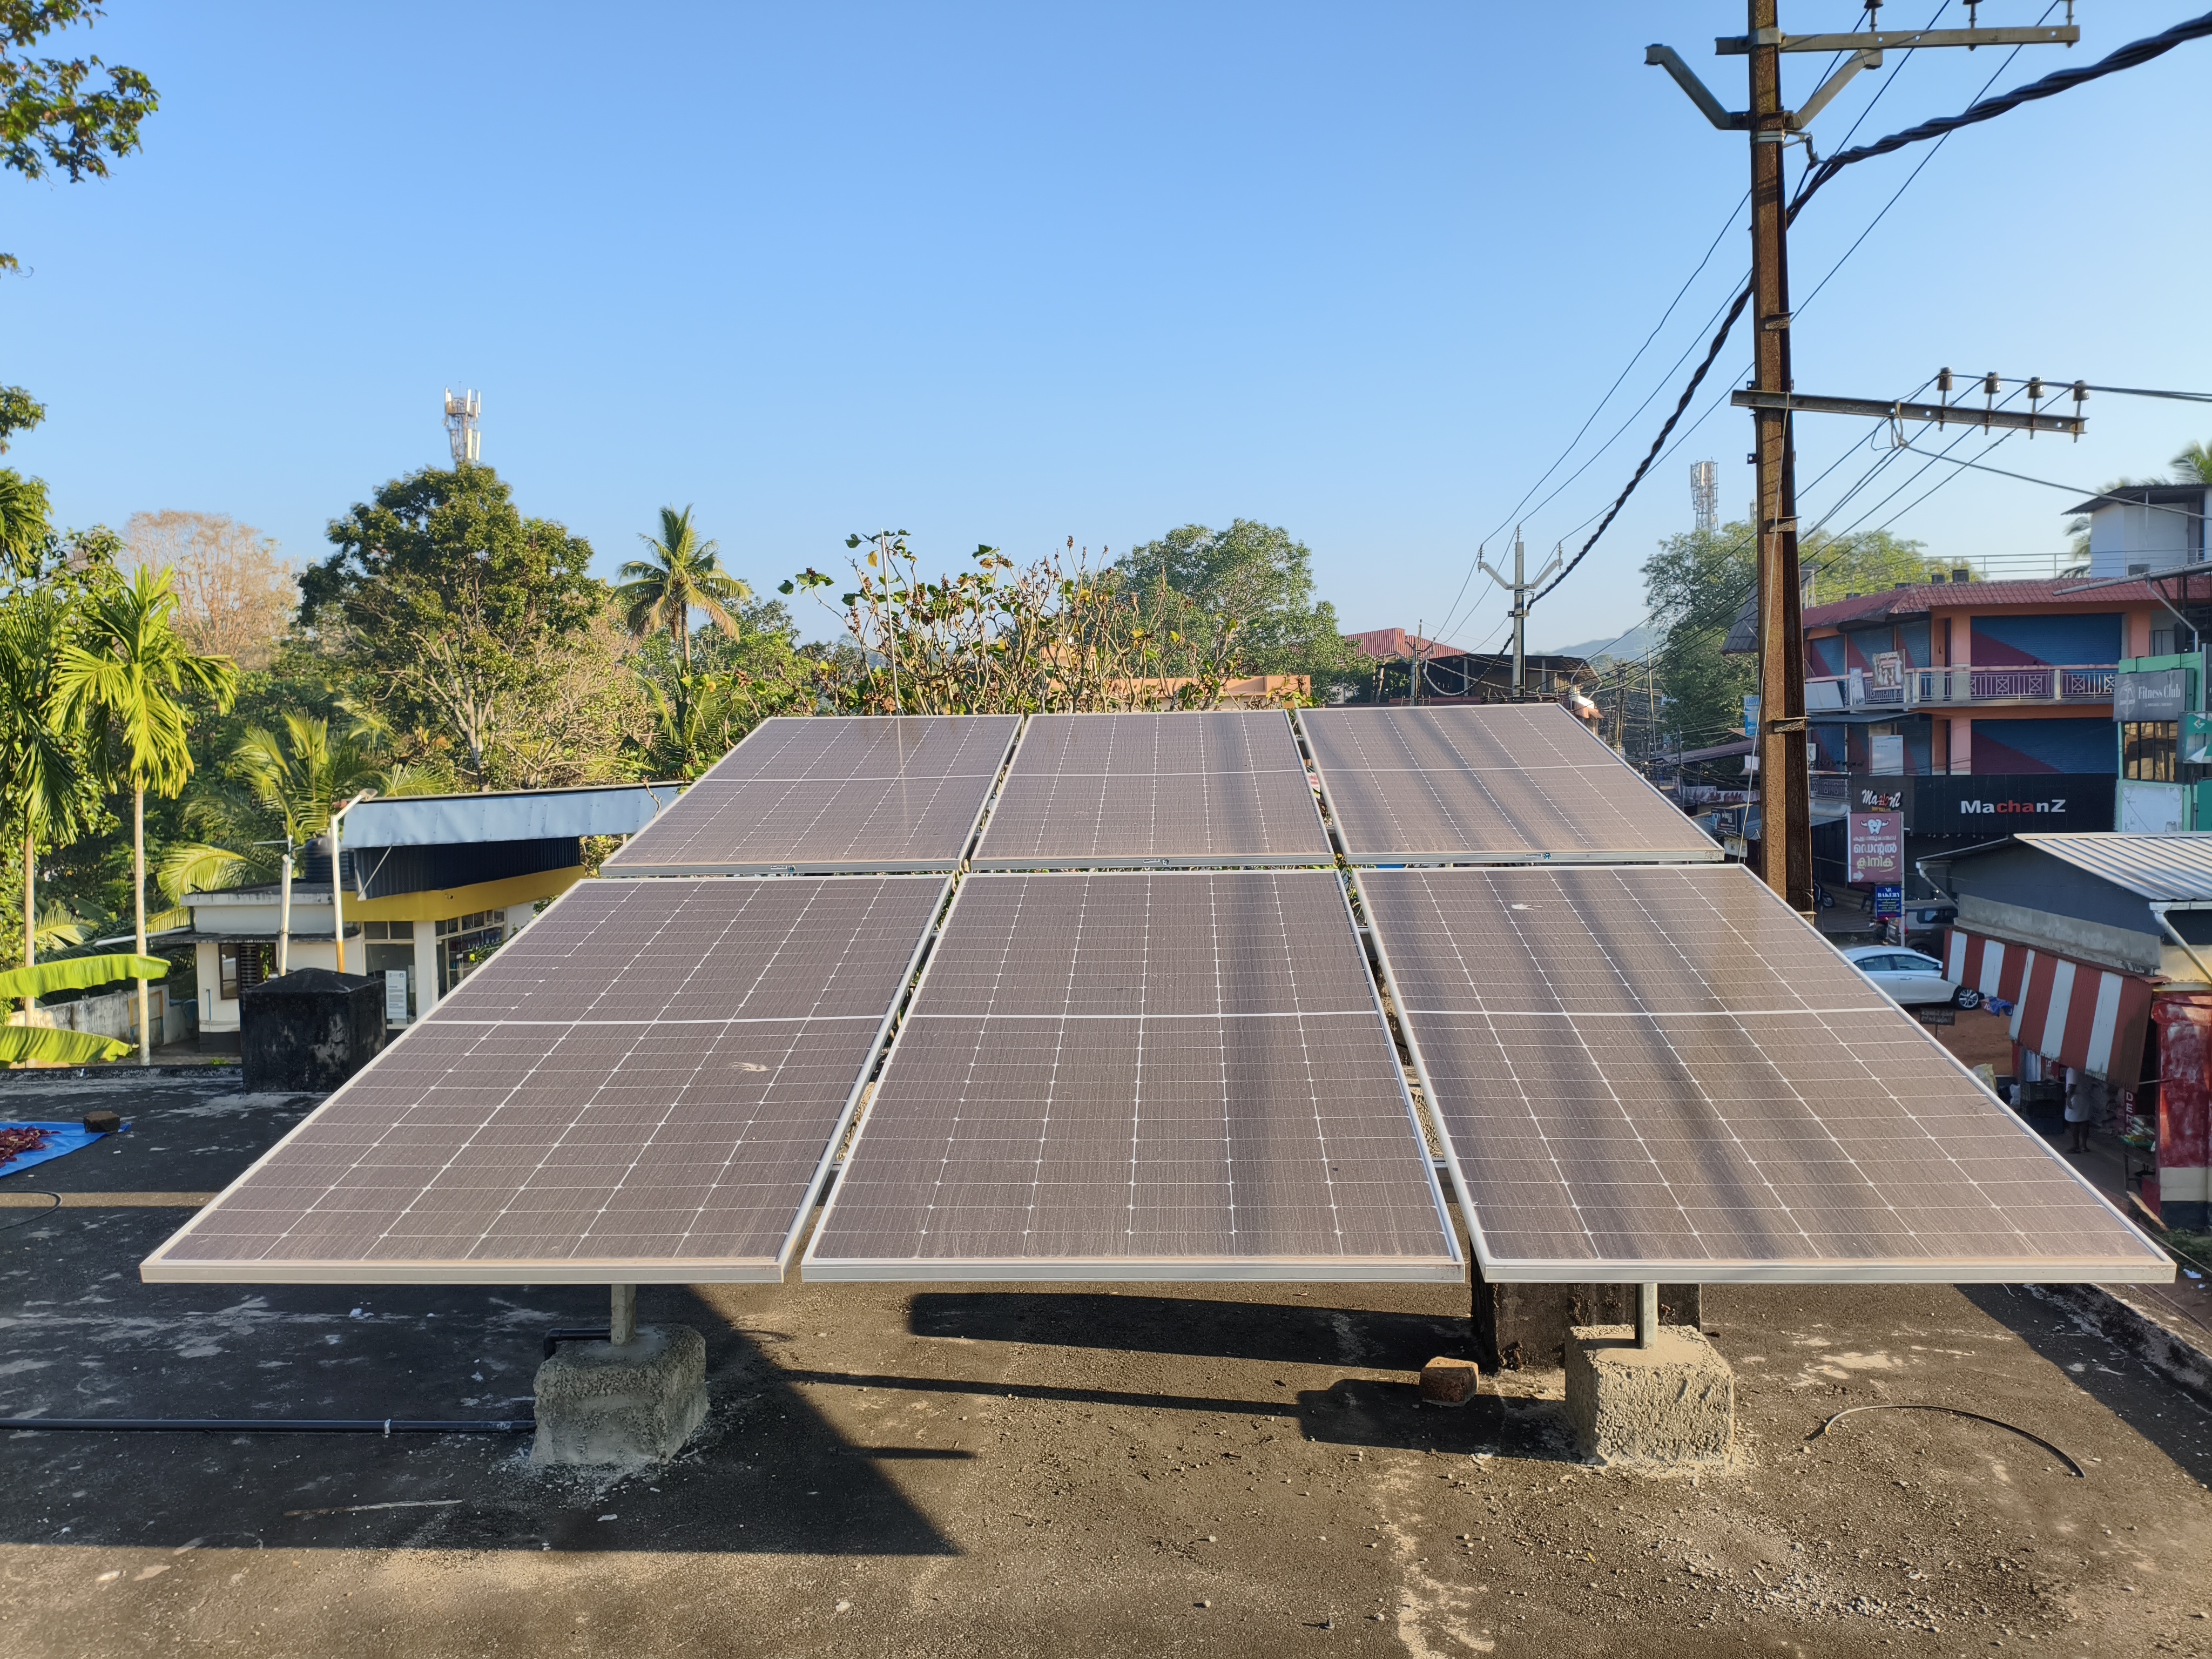
Archive photograph · 2026-01-10 · Location not specified in retained Commons description; household rooftop context

Understand the story.
Four states, different amounts
EIA’s new analysis places California well ahead of Arizona, Texas and Florida in estimated 2025 small-scale solar generation. The graphic uses one year and one energy unit so the state totals can be compared directly. [1]
An energy total is not a saving
These systems are smaller than 1 megawatt of capacity. A state’s total generation depends on how many systems exist as well as their output; it does not tell a homeowner what their own panels will generate or save. [1] [2] [3]
The output needs a model
Utilities report customer counts and capacity, but may not observe all rooftop generation. EIA therefore uses models and assumptions about panel orientation. Keep that estimation boundary beside the large totals. [3]
Before acting on the headline
Use the analysis’s methods and resource links to understand the estimate. For a household decision, the national and state totals leave important questions unanswered: the particular roof, tariff and contract still need examination. [1] [3]
How we know3 scoped claims · 1 source recordView evidence
Each claim keeps its full assertion, date, source passage and limits. Source counts describe records, not independent corroboration.
1.A dated scale comparisonSupported
EIA’s October 16 analysis gives 2025 small-scale solar generation of 34,411 GWh for California, 5,795 for Arizona, 5,408 for Texas and 5,198 for Florida.
- Scope
- United States small-scale photovoltaic systems under 1 megawatt; EIA analysis published October 16, 2026, with selected state generation estimates for 2025. Not a household savings, output guarantee or incentive-eligibility calculation.
- Evidence passage
- In-brief analysis → California, Arizona and Texas/Florida paragraphs; “last year” is 2025.
- As of
- 2026-10-17
- Limit
- Selected states, not a national total or output per customer; GWh measures energy, not capacity or money.
Retrieved 2026-10-17T17:42:26.903Z · U.S. Energy Information Administration
Original agency analysis; generation estimates use models and utility surveys rather than meters on every rooftop.
2.System boundaryAttributed
The analysis defines small-scale solar as photovoltaic systems smaller than 1 megawatt of capacity and says growth varies with resources, added capacity and incentive programs.
- Scope
- United States small-scale photovoltaic systems under 1 megawatt; EIA analysis published October 16, 2026, with selected state generation estimates for 2025. Not a household savings, output guarantee or incentive-eligibility calculation.
- Evidence passage
- Opening definition and state-growth paragraphs.
- As of
- 2026-10-17
- Limit
- Agency explanatory account; no causal effect size for an incentive is established here.
Retrieved 2026-10-17T17:42:26.903Z · U.S. Energy Information Administration
Original agency analysis; generation estimates use models and utility surveys rather than meters on every rooftop.
3.Why these are estimatesSupported
EIA says utility surveys provide customer and capacity data, while generation is estimated with modeling tools and representative tilt and orientation assumptions because utilities may not know rooftop output.
- Scope
- United States small-scale photovoltaic systems under 1 megawatt; EIA analysis published October 16, 2026, with selected state generation estimates for 2025. Not a household savings, output guarantee or incentive-eligibility calculation.
- Evidence passage
- Closing methodology paragraphs → utility surveys, System Advisor Model, PVWatts and tilt/orientation.
- As of
- 2026-10-17
- Limit
- Modeled aggregate output cannot establish an individual roof’s production, bill savings or payback time.
Retrieved 2026-10-17T17:42:26.903Z · U.S. Energy Information Administration
Original agency analysis; generation estimates use models and utility surveys rather than meters on every rooftop.
What remains open.
- No household tariff, roof assessment, financing terms or individual output measured. Incentive eligibility is not verified here.
- The headline’s “quadrupled” wording and introductory endpoints are not reconciled here; the graphic uses the explicitly dated 2025 state figures instead.
- The page illustration refers to 2016–2026 while prose state figures identify 2025. No 2026 final annual total is asserted.
- Rechecked against the current edition. This story’s core development is retained, not new in this update; new receipts and case IDs do not create news.
A corrected original, material new development, changed eligibility, effective date, access rule or product identifier requires a separately identified revision and renewed evidence review.
THIS STORY IN TIME
Keep the dates with the story.
- Reported development
- Evidence as of
- First retained publication
- This version published
Publication times are Central. A development date and an evidence date can differ. Missing dates remain unrecorded.