← 2026-10-31 edition · Sourced reporting
Housing took 33.9% of average spending in the newly released 2025 survey
As of 2026-10-31 · Publication details
Calendar 2025 · BLS release October 29, 2026 · % of total average spending
U.S., all consumer units. Selected categories; shares of $81,905 average annual expenditure, not shares of income or a recommended budget.
United States, Consumer Expenditure Surveys, calendar 2025; all consumer units, not a typical family, individual worker, renter-only sample or current 2026 price reading. Newly released October 29, 2026.
BLS’s October 29 release puts 2025 average annual spending at $81,905 per consumer unit, up 4.3%. Housing took 33.9%. These are spending averages, not today’s prices or a recommended household budget. [1] [2]
Still open: No household-level record or current 2026 price estimate is established. All open questions ↓
If food, housing or utility costs are difficult to cover, use USAGov’s official benefits guide to find relevant programs and application routes. Each program has its own eligibility, income and geographic rules; the national spending averages do not establish an individual entitlement or a target household budget. →Read the full story
The reporting question: Where did the 2025 spending dollar go?
A new release about last year
The October 29 BLS release describes 2025, not this month. Average annual spending was $81,905 per consumer unit, 4.3% above the revised 2024 estimate. Use the release date to judge freshness and the reference year to judge what it measures. [1]
Housing takes the largest displayed share
Housing accounted for 33.9% of total average spending, compared with 16.5% for transportation, 13.0% for food and 7.9% for healthcare. These use the same all-consumer-unit denominator. The four bars are selected categories, not the entire budget. [2]
Spending is more than prices
Housing spending rose 5.8% and food spending 4.6%; BLS marks those dollar-mean changes statistically significant. A spending increase can include prices, quantities and changes in the sample’s circumstances. It cannot by itself tell you how much an unchanged shopping basket became more expensive. [3]
Match the household before comparing
Average spending differs sharply across income groups. The survey also missed October and November 2025 collection and adjusted weights. Before comparing your own costs, use the tables for the relevant population and year; do not treat a national mean as a target you should meet. [4]
Archive photograph · 2011-11-07 · Cleveland, Ohio, United States
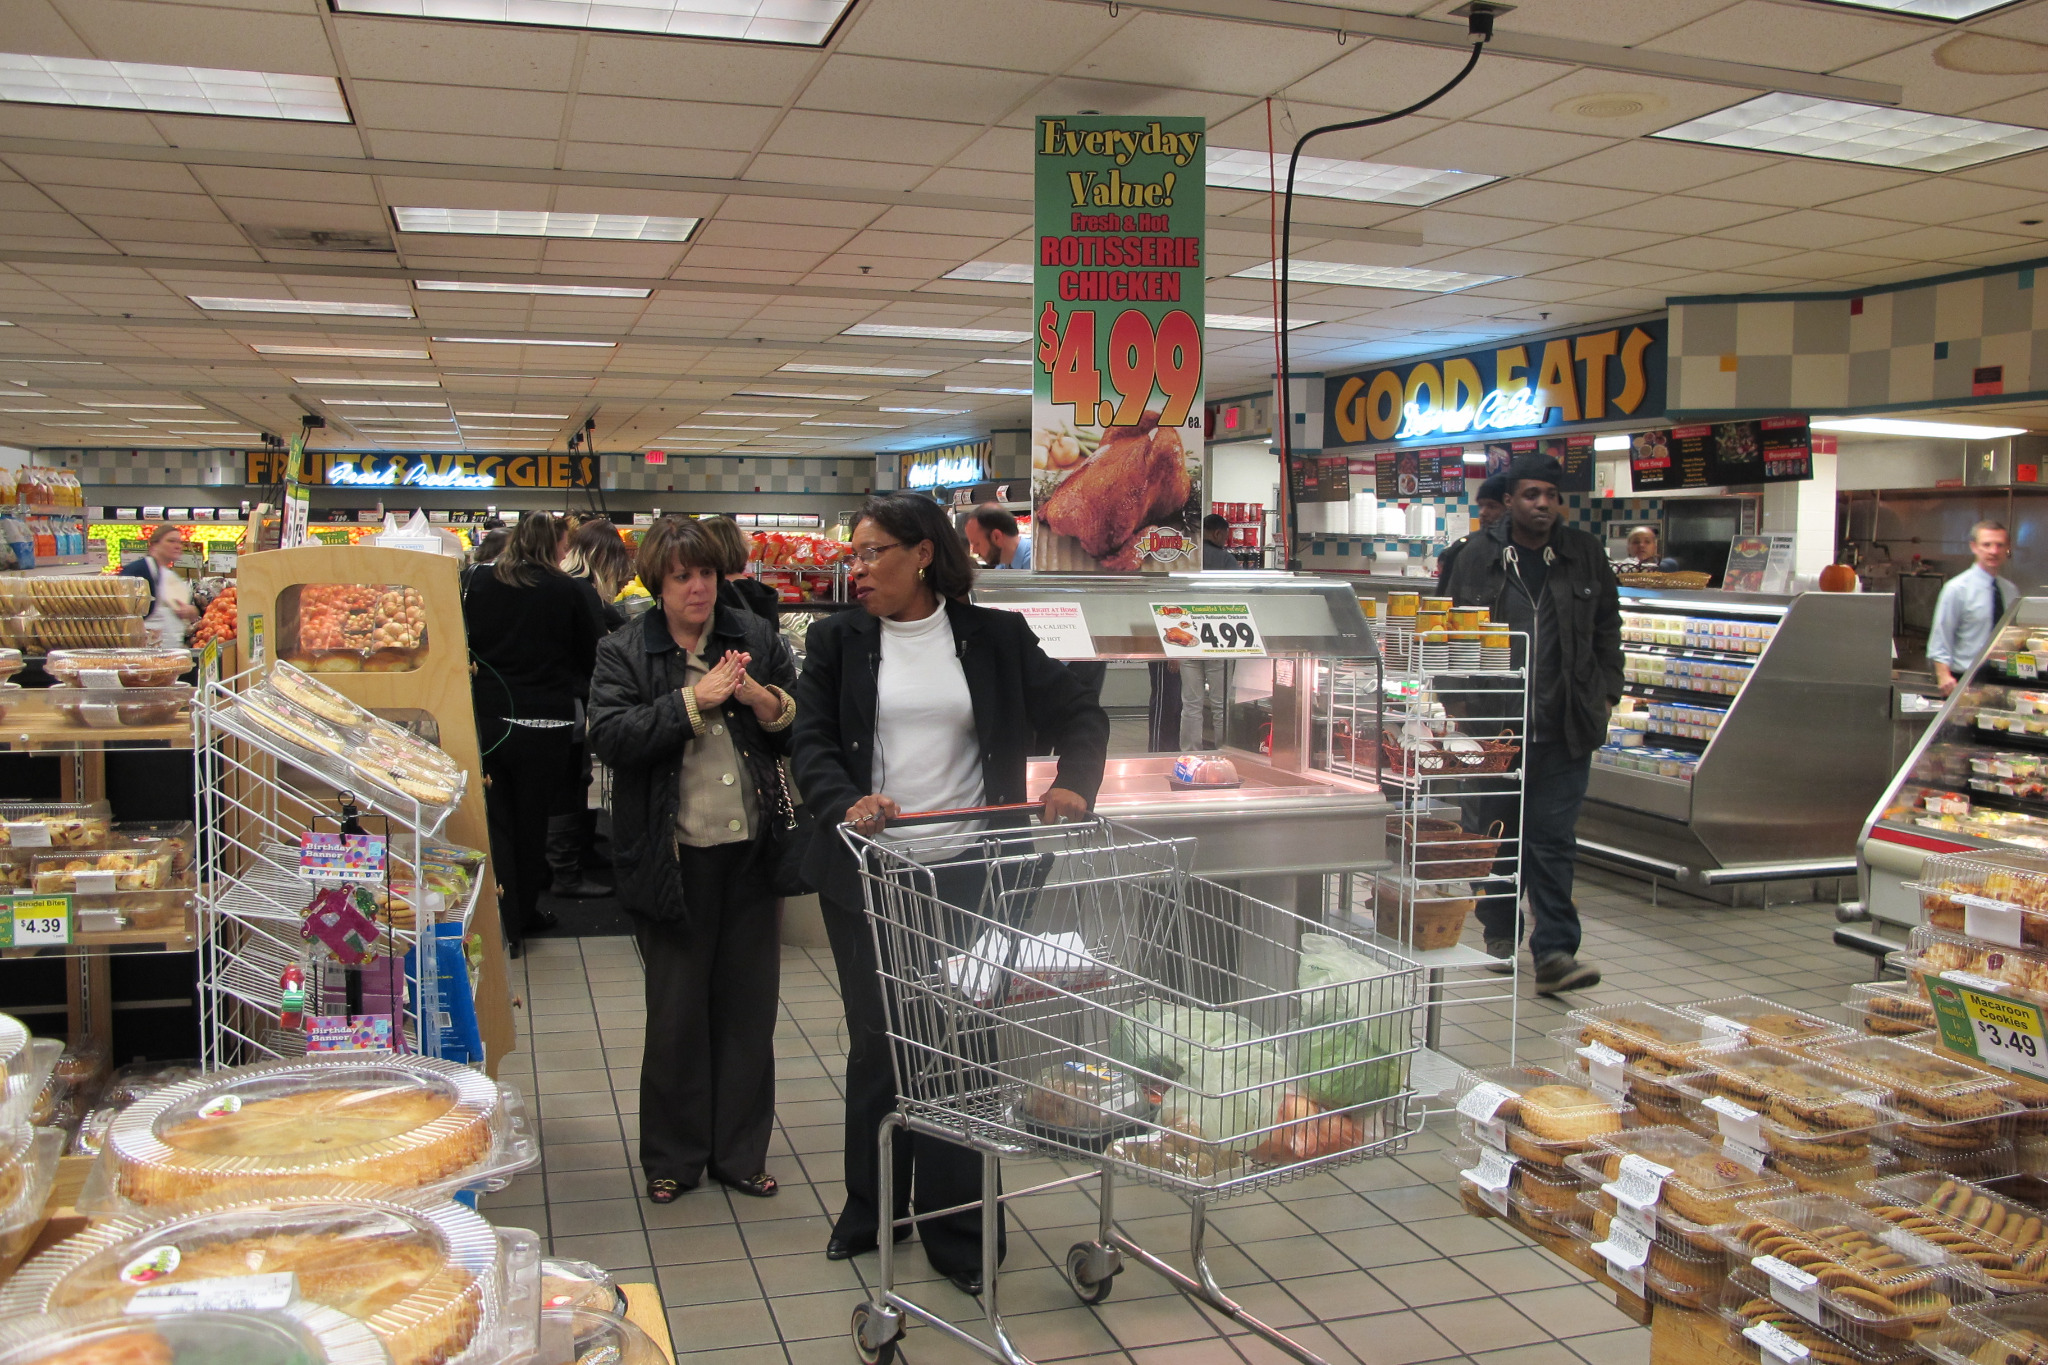


- 1 source record
- U.S. Bureau of Labor Statistics
How we know4 scoped claims · 1 source recordView evidence
Each claim keeps its full assertion, date, source passage and limits. Source counts describe records, not independent corroboration.
1.Average annual spending: $81,905Supported
BLS reports average 2025 annual expenditures of $81,905 per consumer unit, up 4.3% from revised 2024 spending of $78,527.
- Scope
- United States, Consumer Expenditure Surveys, calendar 2025; all consumer units, not a typical family, individual worker, renter-only sample or current 2026 price reading. Newly released October 29, 2026.
- Evidence passage
- Opening paragraph and Table 1, Average annual expenditures row, 2024–2025.
- As of
- 2026-10-31
- Limit
- Nominal spending, not a price index. Corrected 2024 baseline differs from earlier annual releases.
Retrieved 2026-10-31T08:02:02.237Z · U.S. Bureau of Labor Statistics
Federal statistical release with revisions, sampling error, changed weights and missing collection months; descriptive averages cannot establish an individual household’s experience.
2.Housing: 33.9% of spendingSupported
Table 2 gives 2025 shares of total average expenditures: housing 33.9%, transportation 16.5%, food 13.0% and healthcare 7.9%.
- Scope
- United States, Consumer Expenditure Surveys, calendar 2025; all consumer units, not a typical family, individual worker, renter-only sample or current 2026 price reading. Newly released October 29, 2026.
- Evidence passage
- Table 2, Shares of total average annual expenditures by major components, all consumer units, 2025.
- As of
- 2026-10-31
- Limit
- Common denominator: total average annual expenditures across all consumer units. Categories shown are a subset and do not sum to 100; rounding applies.
Retrieved 2026-10-31T08:02:02.237Z · U.S. Bureau of Labor Statistics
Federal statistical release with revisions, sampling error, changed weights and missing collection months; descriptive averages cannot establish an individual household’s experience.
3.Housing spending rose 5.8%Supported
BLS reports statistically significant increases in housing spending of 5.8% and food spending of 4.6% from 2024 to 2025.
- Scope
- United States, Consumer Expenditure Surveys, calendar 2025; all consumer units, not a typical family, individual worker, renter-only sample or current 2026 price reading. Newly released October 29, 2026.
- Evidence passage
- Second narrative paragraph and Table 1 food/housing rows with asterisks; Technical Notes, Significance Testing.
- As of
- 2026-10-31
- Limit
- Significance concerns differences in dollar means, at 95%; expenditure change combines prices, quantities and composition.
Retrieved 2026-10-31T08:02:02.237Z · U.S. Bureau of Labor Statistics
Federal statistical release with revisions, sampling error, changed weights and missing collection months; descriptive averages cannot establish an individual household’s experience.
4.Missing collection months and changing averagesSupported
BLS says CE data could not be collected in October and November 2025 and weights were adjusted. Table 3 shows annual spending averages of $37,935 in the lowest income quintile and $159,512 in the highest.
- Scope
- United States, Consumer Expenditure Surveys, calendar 2025; all consumer units, not a typical family, individual worker, renter-only sample or current 2026 price reading. Newly released October 29, 2026.
- Evidence passage
- Lapse in Federal Appropriations box; Table 3; Technical Notes, Geographic Revisions.
- As of
- 2026-10-31
- Limit
- Weighting is not recovered interviews; income groups are different populations. Do not present the all-unit mean as a universal budget.
Retrieved 2026-10-31T08:02:02.237Z · U.S. Bureau of Labor Statistics
Federal statistical release with revisions, sampling error, changed weights and missing collection months; descriptive averages cannot establish an individual household’s experience.
What remains open.
- No household-level record or current 2026 price estimate is established.
- Missing collection months were adjusted statistically, not observed later. Geographic sample and variance-method changes matter; see Technical Notes.
- The BLS spending release failed the native publisher’s ordinary-reader browser help check on October 31. Its original statistical evidence remains captured unchanged. USAGov benefits guidance is separate practical context; eligibility varies and no benefit award or budget target is inferred from the national mean.
A BLS correction, revised weights or fuller method/quality documentation affecting these estimates.
THIS STORY IN TIME
Keep the dates with the story.
- Reported development
- Evidence as of
- First retained publication
- This version published
Publication times are Central. A development date and an evidence date can differ. Missing dates remain unrecorded.
What readers add.
Comments are reviewed before they appear. Max includes five comments and two custom story requests each day.
Loading reviewed comments…
Add a comment with Max →