← 2026-10-12 edition · Sourced reporting
Published Oct 12, 2026, 10:29 AM Central · This version Oct 12, 2026, 10:29 AM Central · As of 2026-10-12
U.S. job growth slowed. What does that tell job seekers?
The September report shows weak net job growth: 29,000 payroll jobs added, after a revised 133,000 in August. Unemployment was 4.2%. These national estimates describe the market; they cannot predict an individual search. [1] [2]
Read the dated jobs report and its industry tables →United States, September 2026 seasonally adjusted estimates, October 2 release vintage; checked October 12. Net nonfarm payroll employment is not gross hiring or an individual job-search forecast.
- 1 source record
- U.S. Bureau of Labor Statistics
Still open: No state, occupation or local vacancy evidence has been collected. All open questions ↓
Reporting question · As of 2026-10-12
The question: What does September’s jobs report tell people looking for work?
United States, September 2026 seasonally adjusted estimates, October 2 release vintage; checked October 12. Net nonfarm payroll employment is not gross hiring or an individual job-search forecast.
Different measures and populations. These tiles are not a sequence or a common-scale chart. All figures are from the October 2 release, not a live October count.
Read the process as a table
| Component | Meaning | Evidence |
|---|---|---|
| +29,000 jobs | September’s net payroll change, seasonally adjusted. | [1] |
| 4.2% unemployed | A household-survey rate; BLS says it changed little. | [2] |
| 1.9 million people | Unemployed for at least 27 weeks in September. | [3] |
| 60,000 fewer jobs | Downward revision to July and August combined. | [4] |
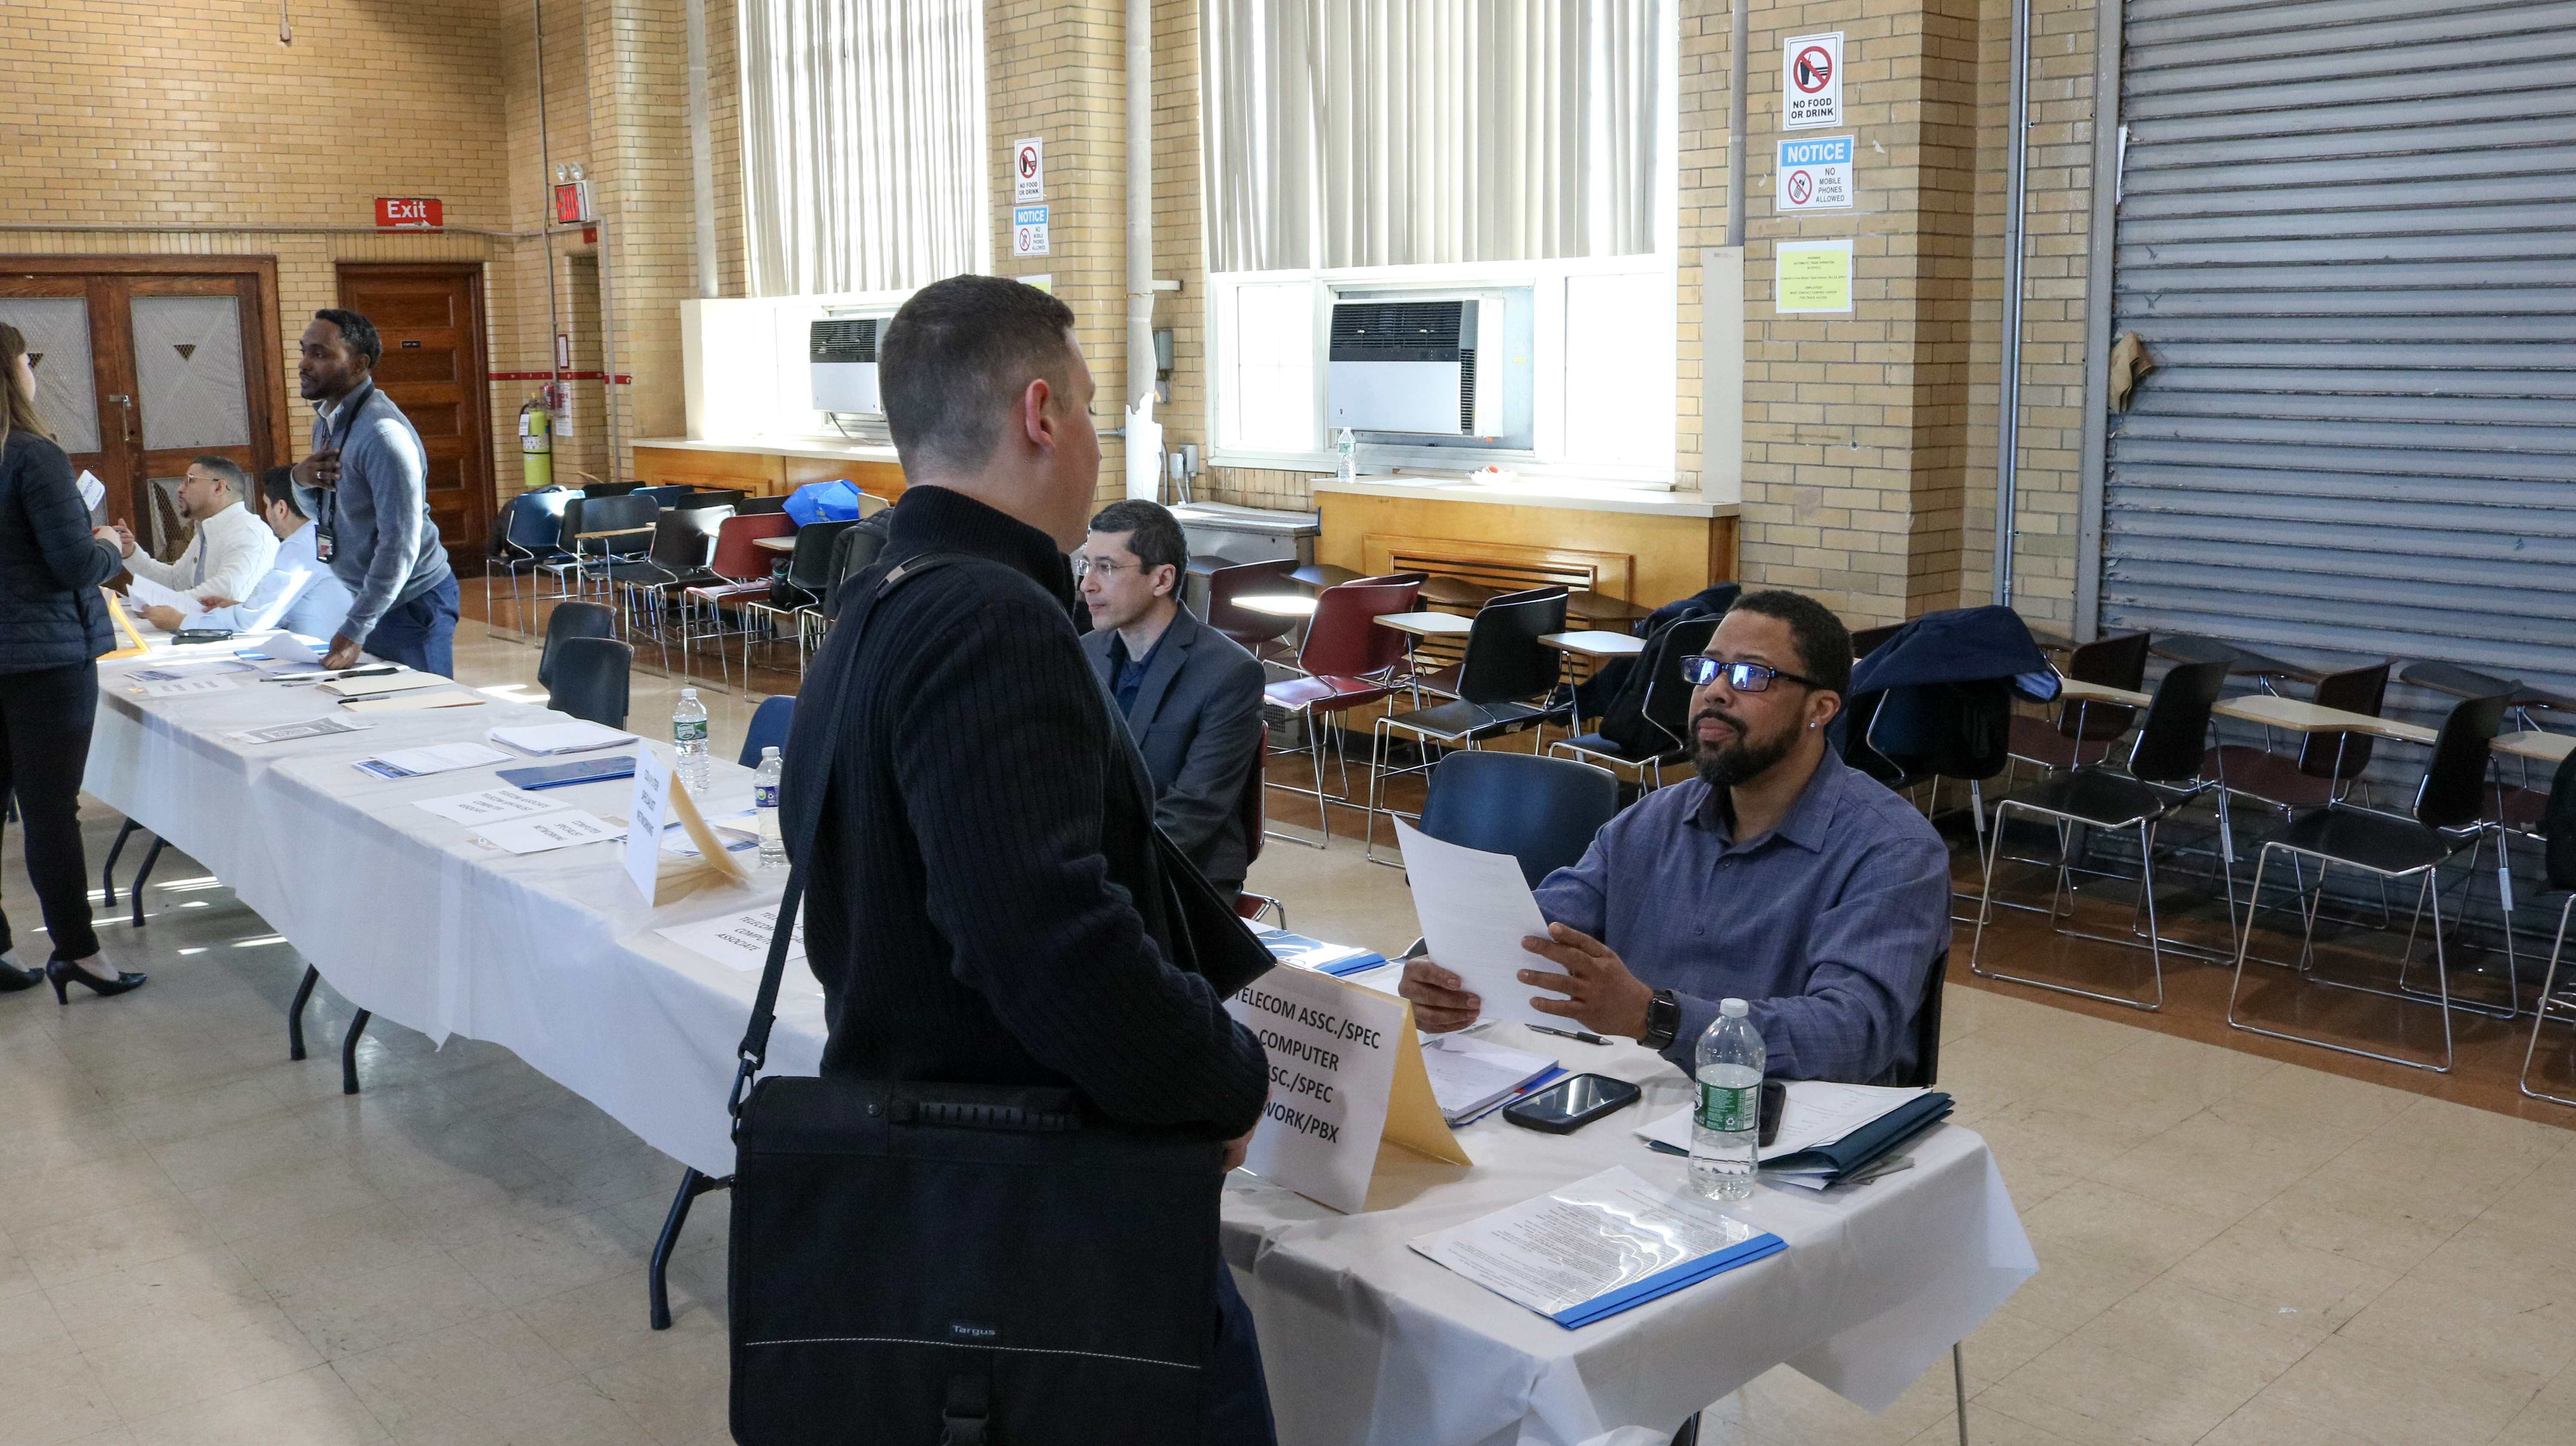
Archive photograph · 2024-02-12 · Brooklyn, New York

Understand the story.
For people looking for work, another figure matters: 1.9 million people had been unemployed for at least 27 weeks. That was 27.1% of unemployed people, according to BLS. [3]
Payroll growth counts the net change in jobs, while unemployment comes from a survey of people. Read them as different measures. BLS describes September’s unemployment rate as little changed. [5] [2]
BLS also lowered its July and August estimates by a combined 60,000 jobs. That revises the earlier picture; it does not describe 60,000 new September layoffs. [4]
The next jobs report is scheduled for November 6. This release alone cannot establish why growth weakened or what will happen next. [5]
How we know5 scoped claims · 1 source recordView evidence
Each claim keeps its full assertion, date, source passage and limits. Source counts describe records, not independent corroboration.
1.Claim 1Supported
BLS reported a seasonally adjusted net increase of 29,000 nonfarm payroll jobs in September 2026, following a revised August increase of 133,000.
- Scope
- The dated source assertion and population specified in the claim; checked October 12, 2026.
- Evidence passage
- Establishment Survey Data, opening paragraph; final July/August revisions paragraph; table B-1, total nonfarm.
- As of
- 2026-10-12
- Limit
- Net change in payroll jobs, not the number of people hired; September is an estimate.
Retrieved 2026-10-12T14:09:28.205Z · U.S. Bureau of Labor Statistics
Sample-based estimates, subject to revisions; national averages do not predict any individual job outcome.
2.Claim 2Supported
BLS reported September unemployment at 4.2%, describing it as little changed and within the 4.1%–4.3% range since March.
- Scope
- The dated source assertion and population specified in the claim; checked October 12, 2026.
- Evidence passage
- Household Survey Data, first paragraph; table A-1.
- As of
- 2026-10-12
- Limit
- A household-survey measure with a different population and definition from payroll employment.
Retrieved 2026-10-12T14:09:28.205Z · U.S. Bureau of Labor Statistics
Sample-based estimates, subject to revisions; national averages do not predict any individual job outcome.
3.Claim 3Supported
BLS reported 1.9 million people unemployed for at least 27 weeks in September, or 27.1% of unemployed people.
- Scope
- The dated source assertion and population specified in the claim; checked October 12, 2026.
- Evidence passage
- Household Survey Data, long-term unemployment paragraph; table A-12.
- As of
- 2026-10-12
- Limit
- National seasonally adjusted estimate; no account of an individual applicant or causal explanation.
Retrieved 2026-10-12T14:09:28.205Z · U.S. Bureau of Labor Statistics
Sample-based estimates, subject to revisions; national averages do not predict any individual job outcome.
4.Claim 4Supported
The October 2 release revised July payroll growth from +21,000 to −10,000 and August from +162,000 to +133,000, a combined downward revision of 60,000 jobs.
- Scope
- The dated source assertion and population specified in the claim; checked October 12, 2026.
- Evidence passage
- Establishment Survey Data, final revisions paragraph.
- As of
- 2026-10-12
- Limit
- A revision to earlier net estimates; not 60,000 newly observed layoffs in September.
Retrieved 2026-10-12T14:09:28.205Z · U.S. Bureau of Labor Statistics
Sample-based estimates, subject to revisions; national averages do not predict any individual job outcome.
5.Claim 5Supported
BLS uses a household survey for labor-force status and an establishment survey for nonfarm jobs, hours and earnings. The October report is scheduled for November 6, 2026.
- Scope
- The dated source assertion and population specified in the claim; checked October 12, 2026.
- Evidence passage
- Introduction describing the two surveys; closing release-schedule paragraph.
- As of
- 2026-10-12
- Limit
- The scheduled release date may change; these surveys alone do not explain hiring decisions.
Retrieved 2026-10-12T14:09:28.205Z · U.S. Bureau of Labor Statistics
Sample-based estimates, subject to revisions; national averages do not predict any individual job outcome.
What remains open.
- No state, occupation or local vacancy evidence has been collected.
- No worker interviews; the report cannot explain any individual job search.
- No causal attribution to immigration, interest rates or other policy has been established.
A newer release, correction or revision, or scoped state and occupation evidence would require a new capture and exact-draft review.
THIS STORY IN TIME
Keep the dates with the story.
- Reported development
- Not recorded
- Evidence as of
- First retained publication
- This version published
Publication times are Central. A development date and an evidence date can differ. Missing dates remain unrecorded.