SOURCED REPORTING · 2026-10-13
Your neighbor’s heating bill could fall. Yours could jump.
EIA’s new winter outlook splits household fuel spending in two: gas and propane down, electricity and heating oil up. Heating oil has the largest forecast rise, 21%. Your fuel, location and actual weather matter. [1] [2] [3] [4]
EIA October 6, 2026 forecast for November 2026–March 2027, checked October 13. Average spending includes all uses of each household’s primary space-heating fuel. Propane covers Northeast, Midwest and South. Forecasts are not actual bills, fuel-switch recommendations or personalized eligibility assessments.
November 2026–March 2027 versus previous winter · % change
Household-weighted Northeast, Midwest and South; excludes West.
EIA October 6 forecast average spending on all uses of a household’s primary heating fuel. Each row compares that fuel’s household population with the previous winter; the rows are not a fuel-switch savings test. Propane covers the Northeast, Midwest and South, excluding the West.
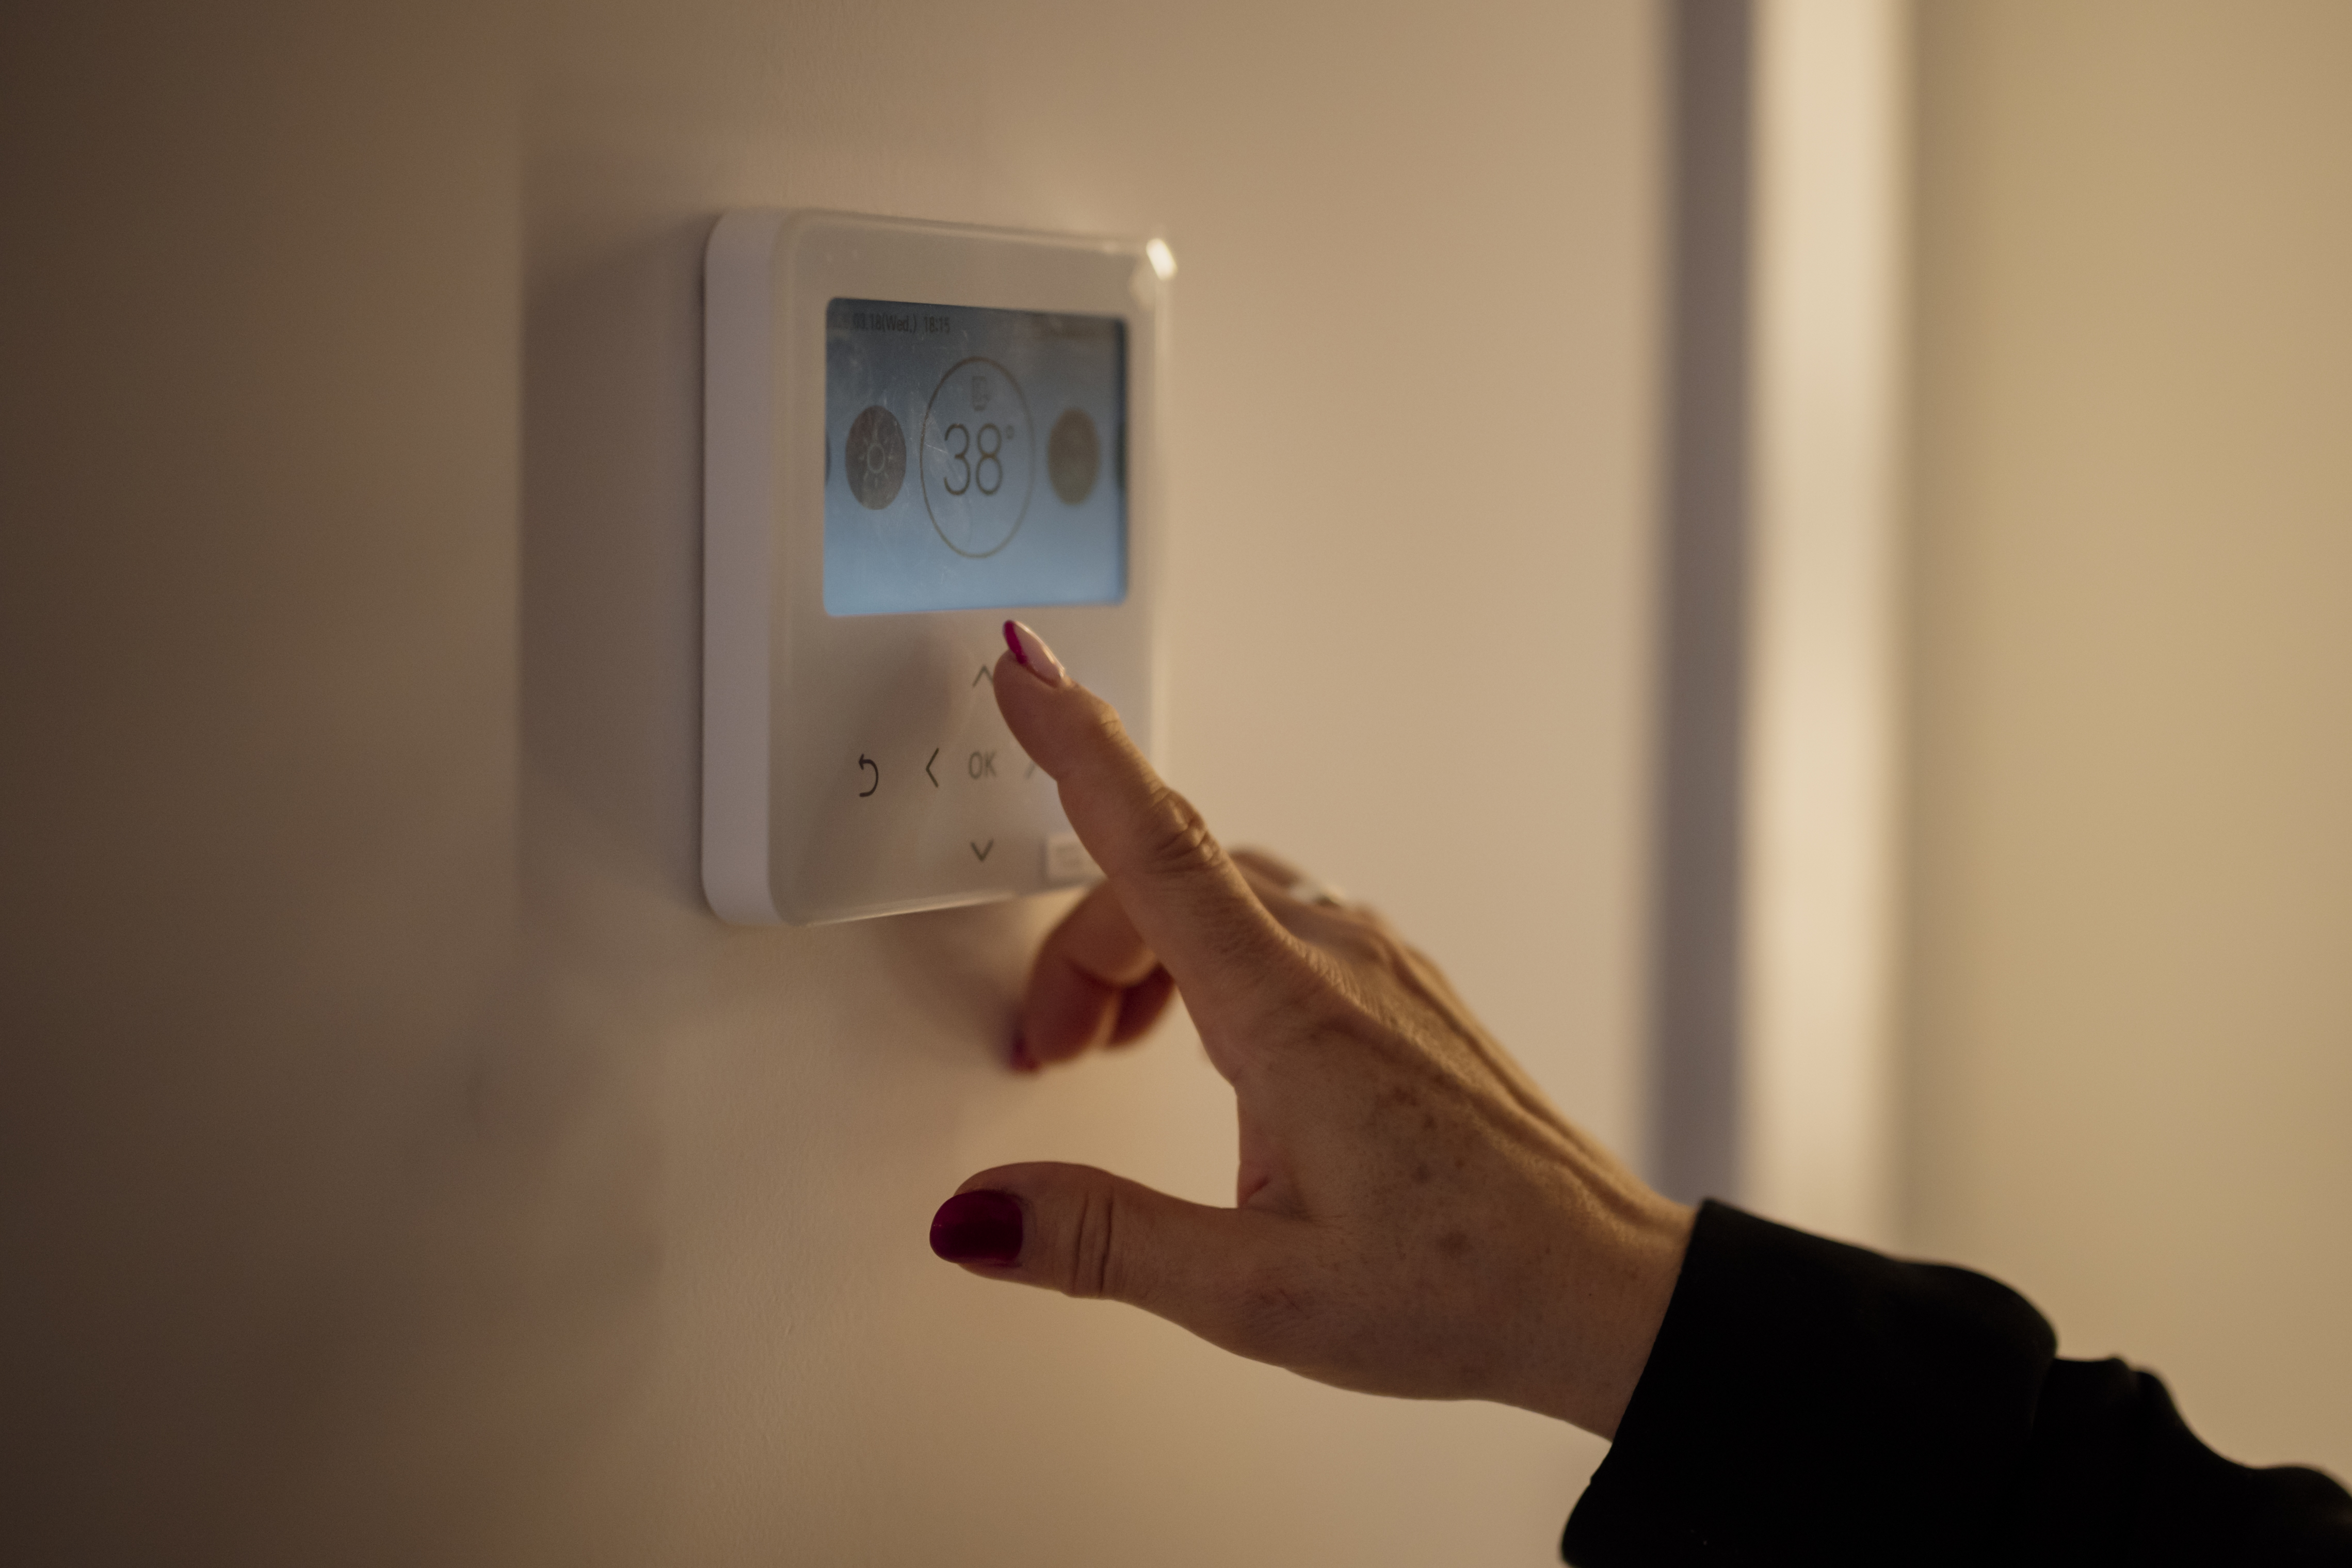
Archive photograph · 2026-03-18 · Location not specified by the photographer
- 4 source records
- U.S. Energy Information Administration
- U.S. General Services Administration
How we know10 scoped claims · 4 source recordsView evidence
Each claim keeps its full assertion, date, source passage and limits. Source counts describe records, not independent corroboration.
1.Natural gas: 9% lowerAttributed
EIA forecasts U.S. average primary-fuel natural gas expenditures of $640 for the five winter months, 9% below the previous winter.
- Scope
- EIA October 6, 2026 base forecast, November 2026–March 2027, average household spending on all uses of its primary space-heating fuel; change versus previous winter.
- Evidence passage
- Energy expenditures, natural gas table, U.S. average Expenditures (dollars), Total and % change columns.
- As of
- 2026-10-13
- Limit
- Forecast average, not a particular household bill. Other household fuels are excluded.
Retrieved 2026-10-13T13:49:24.181Z · U.S. Energy Information Administration
October 6 base forecast, not actual winter bills; includes every use of the primary heating fuel. Old tables remain inside HTML comments and were excluded from extraction.
2.Electricity: 4% higherAttributed
EIA forecasts U.S. average primary-fuel electricity expenditures of $1,196 for the five winter months, 4% above the previous winter.
- Scope
- EIA October 6, 2026 base forecast, November 2026–March 2027, average household spending on all uses of its primary space-heating fuel; change versus previous winter.
- Evidence passage
- Energy expenditures, electricity table, U.S. average Expenditures (dollars), Total and % change columns.
- As of
- 2026-10-13
- Limit
- Electricity includes other uses alongside space heating. Forecast average, not a tariff or personalized bill.
Retrieved 2026-10-13T13:49:24.181Z · U.S. Energy Information Administration
October 6 base forecast, not actual winter bills; includes every use of the primary heating fuel. Old tables remain inside HTML comments and were excluded from extraction.
3.Propane: 3% lowerAttributed
EIA forecasts average primary-fuel propane expenditures of $1,246 for the five winter months, 3% below the previous winter.
- Scope
- EIA October 6, 2026 base forecast, November 2026–March 2027, average household spending on all uses of its primary space-heating fuel; change versus previous winter.
- Evidence passage
- Energy expenditures, propane table, U.S. average Expenditures (dollars), Total and % change columns; note following fuel tables.
- As of
- 2026-10-13
- Limit
- The propane estimate is a household-weighted average of the Northeast, Midwest and South; the West is excluded.
Retrieved 2026-10-13T13:49:24.181Z · U.S. Energy Information Administration
October 6 base forecast, not actual winter bills; includes every use of the primary heating fuel. Old tables remain inside HTML comments and were excluded from extraction.
4.Heating oil: 21% higherAttributed
EIA forecasts U.S. average primary-fuel heating oil expenditures of $2,115 for the five winter months, 21% above the previous winter.
- Scope
- EIA October 6, 2026 base forecast, November 2026–March 2027, average household spending on all uses of its primary space-heating fuel; change versus previous winter.
- Evidence passage
- Energy expenditures, heating oil table, U.S. average Expenditures (dollars), Total and % change columns; press release second paragraph.
- As of
- 2026-10-13
- Limit
- Forecast spending includes every use of the primary fuel; it is not a heating-only or personalized estimate.
Retrieved 2026-10-13T13:49:24.181Z · U.S. Energy Information Administration
October 6 base forecast, not actual winter bills; includes every use of the primary heating fuel. Old tables remain inside HTML comments and were excluded from extraction.
Retrieved 2026-10-13T13:49:24.307Z · U.S. Energy Information Administration
A summary of the same EIA forecast, not an independent confirmation; market assumptions can change.
5.Heating oil faces a different marketAttributed
EIA says heating oil users, about 3% of U.S. households and mostly in the Northeast, face fuel prices over 30% higher than last winter, partly offset by milder forecast weather. East Coast distillate inventories were 32% below the five-year seasonal average in September. EIA describes natural gas inventories as a cushion for demand while distillate markets remain tight.
- Scope
- EIA October 6, 2026 description of heating oil households and September East Coast inventories.
- Evidence passage
- Press release second paragraph, Administrator statement and Distillate inventories bullet.
- As of
- 2026-10-13
- Limit
- Agency explanation and forecast, not independently reconstructed market causality. Inventory geography is East Coast; expenditure geography is U.S.
Retrieved 2026-10-13T13:49:24.307Z · U.S. Energy Information Administration
A summary of the same EIA forecast, not an independent confirmation; market assumptions can change.
6.The national average hides regional differencesAttributed
EIA forecasts West natural gas spending up 7% and electricity spending up 9%; Northeast natural gas spending falls 14% and propane spending falls 15%.
- Scope
- EIA October 6, 2026 base forecast, November 2026–March 2027, average household spending on all uses of its primary space-heating fuel; change versus previous winter.
- Evidence passage
- Energy expenditures, natural gas, electricity and propane Expenditures tables: West and Northeast Total % change rows.
- As of
- 2026-10-13
- Limit
- Regional household averages in their own fuel populations. They do not forecast the bill for any named home.
Retrieved 2026-10-13T13:49:24.181Z · U.S. Energy Information Administration
October 6 base forecast, not actual winter bills; includes every use of the primary heating fuel. Old tables remain inside HTML comments and were excluded from extraction.
7.Weather can reopen the forecastAttributed
EIA uses heating degree days and supplies side cases with all regions 10% colder or warmer than its base case, measured by heating degree days. Weather changes both heating demand and prices.
- Scope
- EIA October 2026 winter-weather methodology.
- Evidence passage
- Weather assumptions, first paragraph and final paragraph before the heating degree days table.
- As of
- 2026-10-13
- Limit
- The 10% is a heating-degree-day variation, not a 10% change in Fahrenheit temperature or a probability interval.
Retrieved 2026-10-13T13:49:24.181Z · U.S. Energy Information Administration
October 6 base forecast, not actual winter bills; includes every use of the primary heating fuel. Old tables remain inside HTML comments and were excluded from extraction.
8.Primary fuel does more than heat roomsAttributed
EIA’s October 2025 analysis explains that fuel use varies with housing geography and that a home’s main heating fuel is often used for water heating, cooking and clothes drying as well. The 2026 outlook includes all uses of the primary heating fuel and warns that lower average expenditure for another fuel does not establish savings from switching.
- Scope
- Historical housing explanation plus October 2026 expenditure scope.
- Evidence passage
- October 2025 analysis, paragraphs starting Evolving trends, Data from our Residential Energy Consumption Survey, and The fuel used for space heating; October 2026 outlook Energy consumption methodology and Comparisons across fuels.
- As of
- 2026-10-13
- Limit
- Historical context does not establish current household shares. Average dollar totals compare different homes and energy uses; no retrofit or fuel-switch assessment is provided.
Retrieved 2026-10-13T13:49:24.181Z · U.S. Energy Information Administration
October 6 base forecast, not actual winter bills; includes every use of the primary heating fuel. Old tables remain inside HTML comments and were excluded from extraction.
Retrieved 2026-10-13T13:49:24.587Z · U.S. Energy Information Administration
Historical explanatory context only; its older heating-fuel shares are not used as current 2026 estimates. Census and RECS inputs are described here but were not independently re-extracted.
9.Use the assistance route for your stateAttributed
USAGov says LIHEAP can assist with heating or cooling bills and energy crises; income and state or territory rules govern eligibility. The page provides a route to the relevant LIHEAP office and describes online or in-person applications.
- Scope
- General U.S. LIHEAP information checked October 13, 2026; page last updated January 13, 2026.
- Evidence passage
- Find out if you are eligible for LIHEAP and apply.
- As of
- 2026-10-13
- Limit
- No benefit amount, approval, open application period, or available funding is established for a specific reader. The linked legacy Clearinghouse host failed TLS verification in a direct fetch; the USAGov guide itself was retrieved successfully.
Retrieved 2026-10-13T13:49:24.788Z · U.S. General Services Administration
Eligibility and applications vary by jurisdiction; no household eligibility or available funding is verified.
10.Disconnection rules require a local checkAttributed
USAGov links to state utility-disconnection policies and contact routes, explaining that policies vary by weather, age, disability and utility provider.
- Scope
- General U.S. guidance; state rules and utility-specific application not assessed.
- Evidence passage
- Find out who to contact if your utilities are disconnected.
- As of
- 2026-10-13
- Limit
- This record does not establish a particular household’s legal protection, shutoff status or urgent-service availability.
Retrieved 2026-10-13T13:49:24.788Z · U.S. General Services Administration
Eligibility and applications vary by jurisdiction; no household eligibility or available funding is verified.
Still open: No actual November 2026–March 2027 household bills or realized weather yet.
What remains unresolved
- No actual November 2026–March 2027 household bills or realized weather yet.
- No individual home, tariff, dealer quote, prepaid fuel contract or equipment-switch assessment.
- Propane’s weighted estimate excludes the West.
- The EIA outlook and press release share a source lineage; they do not independently confirm the forecast.
- No household assistance eligibility, open application period or available program funding established.
A revised EIA outlook, corrected fuel table or changed forecast assumptions would reopen the comparison. New state assistance rules or broken help routes would require recapture. Actual bills and weather would support a later forecast-versus-outcome story while retaining this October snapshot.