← 2026-10-14 edition · Sourced reporting
Published Oct 14, 2026, 7:59 AM Central · This version Oct 14, 2026, 7:59 AM Central · As of 2026-10-14
Gasoline drove September’s price jump. Groceries edged down.
Today’s BLS report shows consumer prices rose 0.6% in September and 3.7% over twelve months. A 9.1% monthly gasoline increase accounted for more than half of the monthly rise. Grocery prices edged down 0.1%. [1] [2]
Read NASA’s appointment announcement, including the start date and change in flight eligibility. →United States CPI-U, September 2026, October 14 release vintage. Monthly figures below are seasonally adjusted; twelve-month figures are unadjusted. National category indexes do not measure any particular household’s bill.
- 1 source record
- U.S. Bureau of Labor Statistics
Still open: United States CPI-U, September 2026, October 14 release vintage. Monthly figures below are seasonally adjusted; twelve-month figures are unadjusted. National category indexes do not measure any particular household’s bill. All open questions ↓
Reporting question · As of 2026-10-14
The question: What drove September’s rise in consumer prices, and did groceries rise with it?
United States CPI-U, September 2026, October 14 release vintage. Monthly figures below are seasonally adjusted; twelve-month figures are unadjusted. National category indexes do not measure any particular household’s bill.
August to September 2026 · seasonally adjusted · percent change
National category indexes with different weights. These bars show rates of change, not contributions to the overall CPI or dollar changes in a household bill.
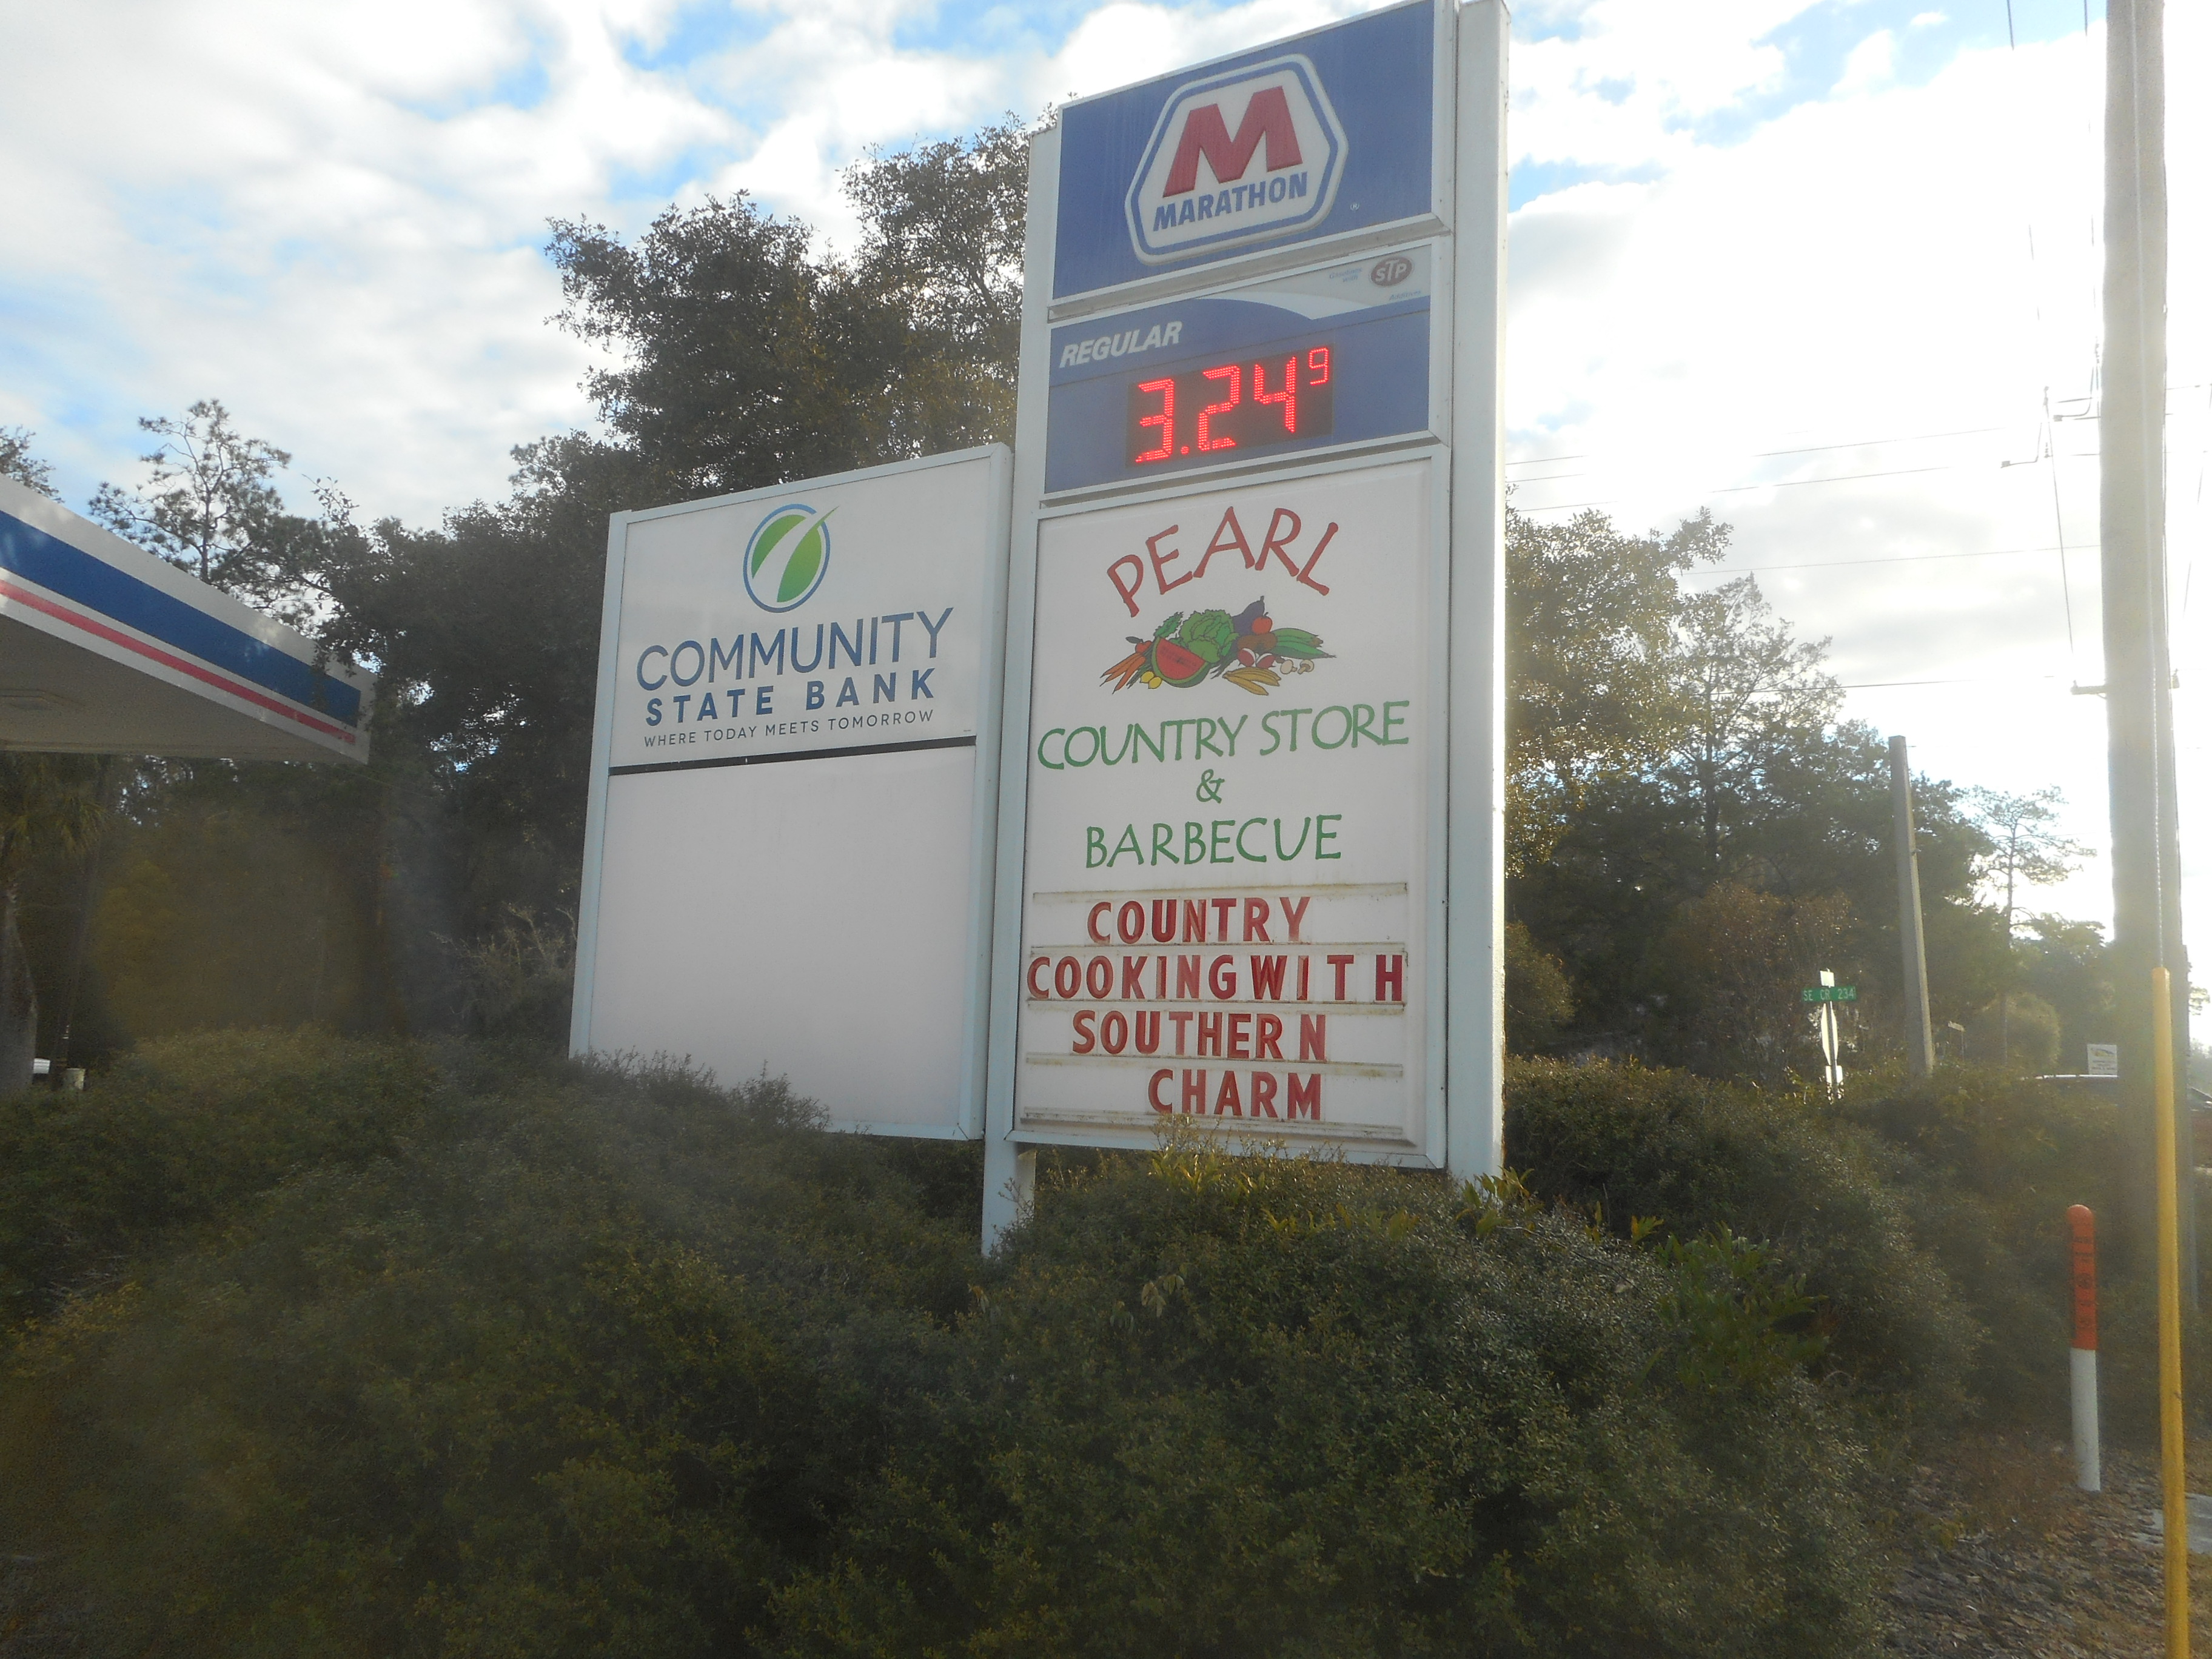
Archive photograph · 2022-12-29 · Micanopy, Florida

Understand the story.
The sharpest pressure was at the pump
Gasoline’s 9.1% monthly rise accounted for more than half of September’s overall increase, BLS reports. The all-items index rose 0.6%. Those are category and overall rates, with different weights. [1] [2]
A grocery basket moved differently
The food-at-home index edged down 0.1%, while shelter rose 0.4%. A headline average can hide this spread. Your spending mix determines which changes you feel most. [3] [4]
Keep a month separate from a year
The 3.7% headline compares September with a year earlier. The chart compares August with September using seasonally adjusted changes. The index excluding food and energy also rose; this release does not predict the next interest-rate decision. [1] [5]
How we know5 scoped claims · 1 source recordView evidence
Each claim keeps its full assertion, date, source passage and limits. Source counts describe records, not independent corroboration.
1.Inflation increasedSupported
BLS reports CPI-U rose 0.6% in September, seasonally adjusted, after 0.4% in August. The unadjusted twelve-month increase was 3.7%, compared with August’s 3.4%.
- Scope
- United States CPI-U, September 2026, October 14 release vintage. Monthly figures below are seasonally adjusted; twelve-month figures are unadjusted. National category indexes do not measure any particular household’s bill.
- Evidence passage
- October 14 CPI summary, opening paragraph and twelve-month paragraph; table A, All items.
- As of
- 2026-10-14
- Limit
- Monthly and twelve-month changes have different periods and seasonal treatments.
Retrieved 2026-10-14T12:31:37.773Z · U.S. Bureau of Labor Statistics
United States CPI-U, September 2026, October 14 release vintage. Monthly figures below are seasonally adjusted; twelve-month figures are unadjusted. National category indexes do not measure any particular household’s bill.
2.Gasoline drove over half the monthly riseSupported
BLS reports gasoline prices rose 9.1% in September and accounted for more than half of the monthly all-items increase.
- Scope
- United States CPI-U, September 2026, October 14 release vintage. Monthly figures below are seasonally adjusted; twelve-month figures are unadjusted. National category indexes do not measure any particular household’s bill.
- Evidence passage
- October 14 CPI summary, second paragraph; table A, Gasoline (all types).
- As of
- 2026-10-14
- Limit
- A national category index, not the price posted at a particular station.
Retrieved 2026-10-14T12:31:37.773Z · U.S. Bureau of Labor Statistics
United States CPI-U, September 2026, October 14 release vintage. Monthly figures below are seasonally adjusted; twelve-month figures are unadjusted. National category indexes do not measure any particular household’s bill.
3.Groceries edged downSupported
BLS reports the food-at-home index fell 0.1% in September, while the overall food index was unchanged.
- Scope
- United States CPI-U, September 2026, October 14 release vintage. Monthly figures below are seasonally adjusted; twelve-month figures are unadjusted. National category indexes do not measure any particular household’s bill.
- Evidence passage
- October 14 CPI summary, second paragraph; Food section; table A, Food at home.
- As of
- 2026-10-14
- Limit
- An average across the category; individual products and households can differ.
Retrieved 2026-10-14T12:31:37.773Z · U.S. Bureau of Labor Statistics
United States CPI-U, September 2026, October 14 release vintage. Monthly figures below are seasonally adjusted; twelve-month figures are unadjusted. National category indexes do not measure any particular household’s bill.
4.Shelter roseSupported
BLS reports the shelter index rose 0.4% in September after rising 0.3% in August.
- Scope
- United States CPI-U, September 2026, October 14 release vintage. Monthly figures below are seasonally adjusted; twelve-month figures are unadjusted. National category indexes do not measure any particular household’s bill.
- Evidence passage
- October 14 CPI summary, second paragraph; table A, Shelter.
- As of
- 2026-10-14
- Limit
- An aggregate index, not the rent change faced by every tenant.
Retrieved 2026-10-14T12:31:37.773Z · U.S. Bureau of Labor Statistics
United States CPI-U, September 2026, October 14 release vintage. Monthly figures below are seasonally adjusted; twelve-month figures are unadjusted. National category indexes do not measure any particular household’s bill.
5.The increase extended beyond energySupported
BLS reports the index excluding food and energy rose 0.3% in September and 2.6% over twelve months.
- Scope
- United States CPI-U, September 2026, October 14 release vintage. Monthly figures below are seasonally adjusted; twelve-month figures are unadjusted. National category indexes do not measure any particular household’s bill.
- Evidence passage
- October 14 CPI summary, third and fourth paragraphs; table A, All items less food and energy.
- As of
- 2026-10-14
- Limit
- Excluding volatile categories does not remove them from household spending.
Retrieved 2026-10-14T12:31:37.773Z · U.S. Bureau of Labor Statistics
United States CPI-U, September 2026, October 14 release vintage. Monthly figures below are seasonally adjusted; twelve-month figures are unadjusted. National category indexes do not measure any particular household’s bill.
What remains open.
- United States CPI-U, September 2026, October 14 release vintage. Monthly figures below are seasonally adjusted; twelve-month figures are unadjusted. National category indexes do not measure any particular household’s bill.
A new official record, correction or material change would trigger a new captured revision and reconciliation of the affected claims.
THIS STORY IN TIME
Keep the dates with the story.
- Reported development
- Evidence as of
- First retained publication
- This version published
Publication times are Central. A development date and an evidence date can differ. Missing dates remain unrecorded.